Chat with newcomers to the exciting world of machine learning, and it won’t be long before their empirical minds start to peek through. Because their training sets are limited, they do what we all naturally do when we lack information — they “fill in the blanks.” They develop incorrect assumptions and generate false associations between various ML concepts.
In this post, I’m going to free your mind and set you down the path of rationality — by dispelling a couple of misconceptions you may have about machine learning.
Dart Throwing is So Regressive
When you practice throwing darts, your brain does what statisticians call regression analysis. This is the process of finding a function that best fits a set of data. The output is called a regression function — what we call a trained model.
Here’s the difference between computer scientists and statisticians. Statisticians spend all their time admiring how pretty the function looks, while we computer scientists recognize it as a representation of a skill, so we’re more interested in finding out what it can do.
Statistician: “This p-value is just simply stunning! The aesthetics, the curvatures — all so intoxicatingly seductive! It’s as if this function was crafted by the deft, delicate hands of a cherub! If there ever was —”
Computer Scientist: “BORING! Hey, I’ve got an idea — let’s put this baby to use! Regression Function, do you know where I can find the best damn burger in the city?”
Regression Function: “Well, based on the reviews on ILuvMeSomeBurgers.com and other burger-rating websites, I’ve concluded that the best damn burger you’ll ever find is at Vinny’s Best Damn Burger Joint — down by the waterfront.”
Computer Scientist: “Great! Can you get us there?”
Regression Function: “Of course! Not only am I a natural language processor, I’m also a self-driving car!”
Statistician: “Egads! How dare you reduce this beautiful function to a base utilitarian! It isn’t meant for such menial tasks! It should instead be painted on the ceiling of the Sistine Chapel — to exemplify the perfection of God!”
Computer Scientist: “Yeah, yeah. You wanna burger or not?”
Statistician: “Well, I am hungry … . Alright, just this once, I’ll condone such crassness.”
Computer Scientist: “Are you sure? What are your pompous mathematician buddies gonna say?”
Statistician: “Ah! Since I’m a statistician, I’ll simply tell them I wasn’t thinking straight because of a bird strike to my head — by a black swan.”
Computer Scientist: “Yay! I’m a black swan! I’m the ugliest ugly duckling you’ve ever seen!”
In the hands of a statistician, regression functions accomplish absolutely nothing. They just sit on pedestals — twiddling their thumbs all day. But in the hands of a computer scientist, they can do a zillion amazing things!
Hi-Diddly-Ho, Neighborinos!
Newbies quite frequently develop two big misconceptions — they mistakenly associate supervised learning with regression analysis and associate unsupervised learning with cluster analysis.
But nowhere in either definition do they say that a specific technique must be used. In unsupervised learning, you can go beyond cluster analysis and use network theory, graph theory, etc. Heck, you can even use beautiful butterfly algorithms or adorable bunny rabbit algorithms — if they’re somehow useful in your project.
The same is true of supervised learning. Regression analysis is far from the only option you have for tackling these kinds of problems. Let’s look at an example.
You’re a happily married guy. And you’d like to stay that way — but you wife has an uncomfortable habit of asking you certain types of questions. These questions are represented by the dots in the graph below. The different colors indicate what the correct answers are.
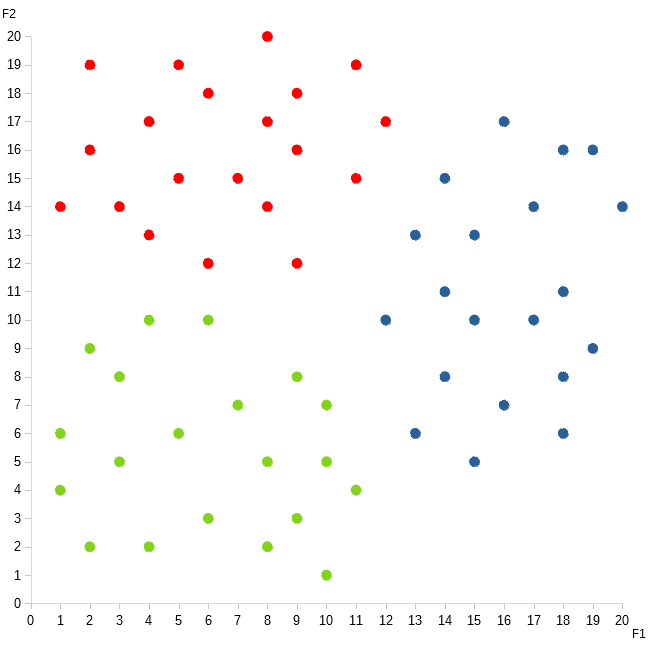
The red dots represent the questions she often asks that go along the lines of, “Does this dress make me look fat?” If you don’t want to sleep on the couch, then the correct answer is, “No, honey. Of course not!”
The blue dots represent questions similar to, “Is it okay if my mom stay with us for a few weeks?” If you want to avoid spending the night in the garage, then it’s extremely important that you respond, “Yes, of course, honey. Even though your mom hates my guts and doesn’t think I’m worthy of you, I would love for her to live with us for as long as she likes!”
The green dots represent variations of your wife’s third favorite question, “If God forbid I pass away before you do, will you remarry?” Now, it’s absolutely imperative that you answer, “Honey, what matters is that I love YOU forever and ever.”
If you tell her, “No, honey, I’ll never remarry,” she’ll be furious. “OH, I GET IT! You see me as a ball-and-chain! Even when I’m dead, you’ll blame me for keeping you from finding happiness!” You’re gonna end up snoozing next to the dog in the doghouse.
If, on the other hand, you answer, “Yes, I’ll remarry,” she’ll still freak out. “I KNEW IT! You’ve never loved me! Even before my body goes cold, you’re gonna run off and marry my best friend, won’t you? I’ve always known there was something going on between you two!” And again, you’ll end up singing the blues with Rufus.
So, what’s the best approach to this learning problem? Well, first, it’s important to note that this graph looks a lot like the rash that you got over the summer, when you fell into that patch of poison ivy. If something reminds you of a rash, you know what that means! It’s CLUSTERING time!
The way you approach clustering in supervised learning is the reverse of how you do it in unsupervised learning. In unsupervised learning, you first start with a trained model that reflects your principles, and use it to produce a set of target values and labels that match those principles. In supervised learning, on the other hand, you start with the target values and labels first, and try to find a trained model that can replicate those values and labels correctly.
Let’s use the k-nearest neighbor ( kNN ) algorithm, which is tailor-made for this type of problem. When it encounters a data point with an unknown label, the algorithm seeks out the opinions of the data point’s surrounding neighbors. After all, who knows you better than your nosy neighbors?
“Oh, he’s definitely a commie spy! He goes in and out at all hours between 6 and 8 in the morning and then again from 6 to 8 at night. I frequently see him wearing a long, dark trenchcoat and a black, wide-brimmed hat — especially on rainy days. Oh, once, I overheard him talking on the phone — ’cause I was crouching under his window — and he was speaking some foreign language. Pig latin, I think. And there was that time when I was strolling thru the park — ’cause I was following him — and I saw him hand a mysterious package to an unknown associate. The package was covered in Christmas wrapping and a bow, but I wasn’t fooled.”
Now there’s a true American patriot! Using his empirical mind to the max!
kNN will assign the same label to an unknown data point as that of its neighbors. The k represents how many neighbors it should talk to. If k = 1, then the algorithm will only talk to the data point’s nearest neighbor. If k = 2, it will talk to the two nearest neighbors, and so on.
One problem with k being greater than one is that there’s a good chance the algorithm will collect conflicting information. There are a few ways to resolve this, but the popular way is to simply take the majority opinion.
The great thing about kNN is that there is actually very little to learn — since it incorporates the entire training set into the trained model. It’s the equivalent of you bringing all your homework assignments to your final exam. You would compare each exam question to every homework problem in order to find the one that’s most similar. Once you find a good match, you literally copy the solution word for word into your exam.
Unlike clustering in unsupervised learning, you don’t need to worry about a myriad of options. You only need to figure out two things. First, you need to determine the best similarity measure to use. This measure will determine which data points are to be considered the nearest neighbors. Second, you need to find the optimal k value. Perhaps talking to three neighbors instead of one produces much better results, or whatever. Each combination creates a different trained model:
TM1(  ) = kNN( similarity = euclidean distance, k = 1 )
TM2(  ) = kNN( similarity = manhattan distance, k = 1 )
TM3(  ) = kNN( similarity = euclidean distance, k = 2 )
TM4(  ) = kNN( similarity = manhattan distance, k = 2 )
etc.
How do you figure out which TMi( ) is the best? One method is to split the training data into two parts. One part gets incorporated into each trained model, while the other is left for training purposes. You then run each TMi( ) on the latter part to see which one can most accurately replicate the actual labels.
Okay, so the machine learning algorithm in your head does a few rounds of calculations, and then settles on TMfinal( ) = kNN( similarity = euclidean distance, k = 4 ). This means that when your wife asks you an unfamiliar question, you will probably get the best results if you check the four most closely-matched questions that you already know the answers to, and then reply with that same answer.
One evening, your wife suddenly throws you a curveball. “Do you think my identical twin sister is prettier than me?” This question is represented by the grey dot in the graph below. The circle highlights its four nearest neighbors.
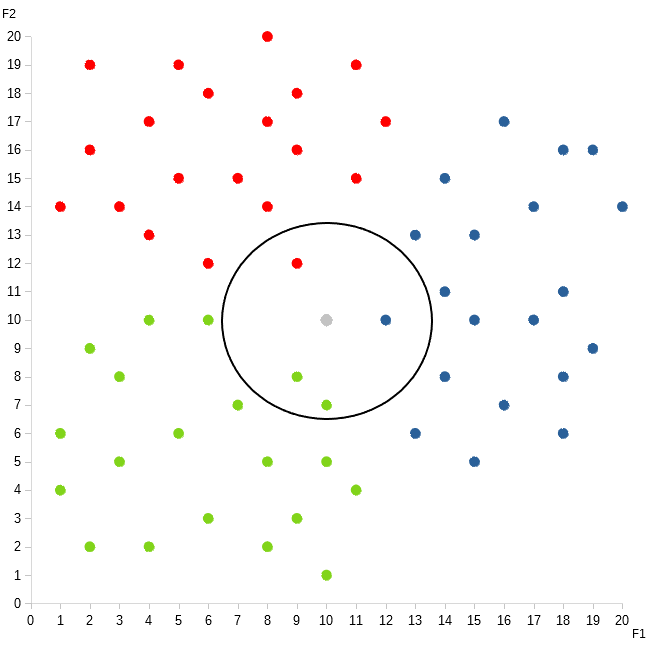
Every red dot is yelling, “She’s definitely asking about some body part of hers!”
All the blue dots are screaming, “Nah, man, her question is definitely about one of her relatives!”
While the green dots are all going, “Nope! She’s definitely wondering if you have googly-eyes for another woman!”
The grey dot’s four closest neighbors are: two greens, one red, and one blue. So you answer, “Honey, what matters is that I love YOU forever and ever.”
As you wait for her reaction, you start to gather your blanket, your pillow, and a flea collar. But then, she walks over to you and gives you a big, fat kiss. Phew! kNN saves the day!
Learning Problems All The Way Down
Because I discussed the different types of learning problems in separate posts, you may have gotten the impression that learning problems happen in isolation. In reality, they quite often get mashed up together and layered on top of one another.
A popular type of recommender system uses a technique called collaborative filtering. Rather than use demographic data or social networks like the recommenders discussed in a previous post, this system relies on user ratings. It first tries to group similar users together, based on how they’ve rated various types of movies across different genres. For example, if two users normally give romance movies four out of five stars, while giving documentaries one star and action movies three stars, then these users probably belong together in the same group. This would be the unsupervised learning aspect of the system.
Once the recommender has organized its users into groups, it then looks at all the movies that all the members in each group have collectively seen. Most of the members would not have seen all the movies. So, based on the ratings of the movies a user have watched, the recommender tries to infer how she would rate an unseen movie if she were to watch it. It would then recommend the ones that it thinks she would rate highly. This is the semi-supervised learning part.
But, wait, there’s more! Companies don’t create recommender systems as a public service. They’re trying to make money. So how do they know which type of system would produce the most profits? They figure that out by bolting on a reinforcement learning exercise on top. By testing different systems on various segments of their user base, they’re able to determine which recommenders are the most effective on whom.
A similar situation exists in marketing as well. The creative team designs ads that encourage people to buy a product. This would be unsupervised learning. But, it doesn’t know which ads are the best at generating clicks and conversions, so it sends the ads over to the analytics folks, who then run A / B tests to find the most compelling ones. This would be reinforcement learning.
Best Way to Approach a Machine Learning Project
Finally, since most real world ML projects are mashups of all three types of learning problems, things can get really confusing as to what’s going on, and what you need to do when and where. To keep from getting overwhelmed, the best way to tackle your project is to utilize the analogies and signposts that I’ve armed you with:
| Learning Problem | Analogy | a. k. a. |
|---|---|---|
| supervised learning | dart throwing with a dartboard | target practice |
| unsupervised learning | dart throwing w/o a dartboard | art |
| reinforcement learning | dart throwing blindfolded | life / the human condition |
Ask yourself,
- Does the learning model have to aim at something? Then this portion of your project is supervised learning.
- Is the problem more open-ended, thus allowing the model to let its freak flag fly? Then it’s unsupervised learning.
- If the model is missing some critical information that it needs to figure out first before it can do the right thing, then it’s reinforcement learning.