Chat with newcomers to the exciting world of machine learning, and it won’t be long before they start dispensing the term, “supervised learning,” like candy.
- “Have you tried solving it with supervised learning?”
- “Using supervised learning, I was able to come up with these great insights.”
- “Those data issues were causing all kinds of problems until I used supervised learning to fix them.”
- “A drop of supervised learning will get that stain right out!”
I’m not exactly sure why they do this. My guess is that they’re trying very hard to sound cool. Supervised learning is probably one of the first concepts they learn that they think they understand. Unfortunately, they just end up sounding dorky.
In this post, I’ll explain what supervised learning really is. By the time you finish reading, you’ll truly understand the concept. More importantly, you’ll become an authentically cool kid — and not a dork who only thinks he is.
Components Of A Supervised Learning Problem
The first time I heard “supervised learning”, I imagined an intimidating nun lording over me, ready to rap my knuckles with her menacing slide rule whenever I got distracted from or otherwise lost focus in my studies. Thankfully, supervised learning doesn’t involve nuns. The supervision actually comes from the training data itself.
Before defining the term, though, we need to look at the components that make up a supervised learning problem. Let’s begin with a list of the data points that the learning model will be training on.
| Data Point |
|---|
| dp1 |
| dp2 |
| dp3 |
| dp4 |
| dp5 |
| dp6 |
| etc. |
The data set contains a target variable, and each data point has a unique target value, which describes the data point in some way. Depending on what the data is about, the target variable can pretty much be anything. Temperature, distance, gradient, price, amplitude of a sound, number of people in a given area — whatever.
| Data Point | Target Variable |
|---|---|
| dp1 | tv1 |
| dp2 | tv2 |
| dp3 | tv3 |
| dp4 | tv4 |
| dp5 | tv5 |
| dp6 | tv6 |
| etc. | etc. |
For some problems, the data points may also include labels — which is a way to partition the training set into categories.
| Data Point | Target Variable | Label |
|---|---|---|
| dp1 | tv1 | lbl1 |
| dp2 | tv2 | lbl2 |
| dp3 | tv3 | lbl3 |
| dp4 | tv4 | lbl2 |
| dp5 | tv5 | lbl4 |
| dp6 | tv6 | lbl3 |
| etc. | etc. | etc. |
Label definitions describe the conditions that must be satisfied in order for a data point to receive a particular label.
lbl2 → target variable is between the values a and b
lbl3 → target variable is between the values b and c
lbl4 → target variable is greater than the value c
| Data Point | Target Variable | Label |
|---|---|---|
| dp1 | tv1 | lbl1 |
| dp2 | tv2 | lbl2 |
| dp3 | tv3 | lbl3 |
| dp4 | tv4 | lbl2 |
| dp5 | tv5 | lbl4 |
| dp6 | tv6 | lbl3 |
| etc. | etc. | etc. |
Often, the labels are colored to make them easier to distinguish from one another. Red is a popular choice. Blue, green, and yellow are good choices as well.
lbl2 → target variable is between the values a and b
lbl3 → target variable is between the values b and c
lbl4 → target variable is greater than the value c
| Data Point | Target Variable | Label |
|---|---|---|
| dp1 | tv1 | lbl1 |
| dp2 | tv2 | lbl2 |
| dp3 | tv3 | lbl3 |
| dp4 | tv4 | lbl2 |
| dp5 | tv5 | lbl4 |
| dp6 | tv6 | lbl3 |
| etc. | etc. | etc. |
The training set also has additional variables, called features — with each data point having unique feature values. These feature values describe the data point in more detail. Like the target variable, feature variables can be anything, depending on what the training set is about. Temperature, distance, gradient, price, amplitude of a sound, number of people in a given area — whatever. The only thing that matters is that each feature impacts the target variable in some way.
lbl2 → target variable is between the values a and b
lbl3 → target variable is between the values b and c
lbl4 → target variable is greater than the value c
| Data Point | Feature 1 | Feature 2 | Feature 3 | … | Target Variable | Label |
|---|---|---|---|---|---|---|
| dp1 | f1-1 | f2-1 | f3-1 | … | tv1 | lbl1 |
| dp2 | f1-2 | f2-2 | f3-2 | … | tv2 | lbl2 |
| dp3 | f1-3 | f2-3 | f3-3 | … | tv3 | lbl3 |
| dp4 | f1-4 | f2-4 | f3-4 | … | tv4 | lbl2 |
| dp5 | f1-5 | f2-5 | f3-5 | … | tv5 | lbl4 |
| dp6 | f1-6 | f2-6 | f3-6 | … | tv6 | lbl3 |
| etc. | etc. | etc. | etc. | etc. | etc. | etc. |
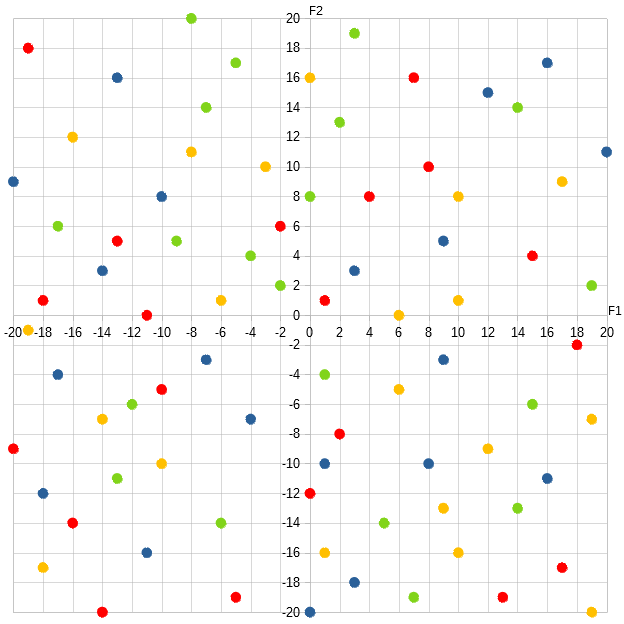
When we plot the data on a graph, you’ll usually see the data points represented as dots, and colored with the labels they’re given.
Here’s an example of a two-dimensional featurespace representation of the data points, based on their F1 and F2 feature values:
The Textbook Definition
Okay, now that we have the components, onward to the definition! Supervised learning basically boils down to a task where the learning model needs to correctly replicate each data point’s target value ( tv1 for dp1; tv2 for dp2, etc. ), but do it with only the information provided by the data point’s features ( f1-1, f2-1, f3-1, … for dp1; f1-2, f2-2, f3-2, … for dp2, etc. ).
The target variable is the sole reason why this type of problem is called “supervised learning”. It singularly determines whether the learning model is correct or not. For example, if the data set represents all the homework problems in a textbook, then the target variable represents the solutions in the back. If the student’s answers do not match the solutions, then he has to continue studying until he can derive the right answers. The target variable dictates the entire learning process — thus, it’s the supervisor.
The formal definition is this — the learning model must find a trained model that best describes the relationship between each data point’s feature values and its target value. Let’s represent the trained model with the function, TM( ), whose parameters are the feature variables, and whose output is the target variable: TM( f1, f2, … ) = tv. So,
TM( f1-1, f2-1, f3-1, … ) = tv1
TM( f1-2, f2-2, f3-2, … ) = tv2
TM( f1-3, f2-3, f3-3, … ) = tv3
TM( f1-4, f2-4, f3-4, … ) = tv4
TM( f1-5, f2-5, f3-5, … ) = tv5
TM( f1-6, f2-6, f3-6, … ) = tv6
etc.
Now, it’s nice that we have a neat, organized lookup table, but this doesn’t really help the learning model much. The whole point of learning is to describe the relationship in such a way that the learning model can plug in an unfamiliar data point which isn’t in the training set and still be able to correctly identify the target value.
TM( f1-new, f2-new, f3-new, … ) = tvnewThis means it’s better if we can somehow represent the trained model with an equation of some sort, like:
( 2 * ( f1 ) + √f2 ) / f3 + … = tvUnfortunately, finding the right equation is not easy. This is where all the fancy-schmancy statistics come in — to make things just a tad easier.
The learning model usually begins with some random equation, TM1( ). Actually, oftentimes we can extract clues from the training data and from the details of the particular problem to “mentor” the learning model and provide “hints” about what the correct equation should look like. So it’s not entirely random; it’s often more like an educated guess.
The learning model plugs each data point into TM1( ) and gets predicted target values back.
TM1( f1-1, f2-1, f3-1, … ) = ptv1-1
TM1( f1-2, f2-2, f3-2, … ) = ptv1-2
TM1( f1-3, f2-3, f3-3, … ) = ptv1-3
TM1( f1-4, f2-4, f3-4, … ) = ptv1-4
TM1( f1-5, f2-5, f3-5, … ) = ptv1-5
TM1( f1-6, f2-6, f3-6, … ) = ptv1-6
etc.
And if the data points have labels, the trained model also derives predicted labels.
TM1( f1-1, f2-1, f3-1, … ) = ptv1-1, plbl1
TM1( f1-2, f2-2, f3-2, … ) = ptv1-2, plbl1
TM1( f1-3, f2-3, f3-3, … ) = ptv1-3, plbl2
TM1( f1-4, f2-4, f3-4, … ) = ptv1-4, plbl3
TM1( f1-5, f2-5, f3-5, … ) = ptv1-5, plbl2
TM1( f1-6, f2-6, f3-6, … ) = ptv1-6, plbl4
etc.
Our table now looks like this:
TM( ) = ?plbl1, lbl1 → ( predicted ) target variable is less than the value a
plbl2, lbl2 → ( predicted ) target variable is between the values a and b
plbl3, lbl3 → ( predicted ) target variable is between the values b and c
plbl4, lbl4 → ( predicted ) target variable is greater than the value c
| Data Point | Feature 1 | Feature 2 | Feature 3 | … | TM( ) Used | Predicted Target Variable | Predicted Label | Target Variable | Label |
|---|---|---|---|---|---|---|---|---|---|
| dp1 | f1-1 | f2-1 | f3-1 | … | TM1() | ptv1-1 | plbl1 | tv1 | lbl1 |
| dp2 | f1-2 | f2-2 | f3-2 | … | TM1() | ptv1-2 | plbl1 | tv2 | lbl2 |
| dp3 | f1-3 | f2-3 | f3-3 | … | TM1() | ptv1-3 | plbl2 | tv3 | lbl3 |
| dp4 | f1-4 | f2-4 | f3-4 | … | TM1() | ptv1-4 | plbl3 | tv4 | lbl2 |
| dp5 | f1-5 | f2-5 | f3-5 | … | TM1() | ptv1-5 | plbl2 | tv5 | lbl4 |
| dp6 | f1-6 | f2-6 | f3-6 | … | TM1() | ptv1-6 | plbl4 | tv6 | lbl3 |
| etc. | etc. | etc. | etc. | etc. | etc. | etc. | etc. | etc. | etc. |
The learning model then compares the predicted target variable with the actual target variable to determine how far off it is, which is called the error.
TM( ) = ?plbl1, lbl1 → ( predicted ) target variable is less than the value a
plbl2, lbl2 → ( predicted ) target variable is between the values a and b
plbl3, lbl3 → ( predicted ) target variable is between the values b and c
plbl4, lbl4 → ( predicted ) target variable is greater than the value c
| Data Point | Feature 1 | Feature 2 | Feature 3 | … | TM( ) Used | Predicted Target Variable | Predicted Label | Target Variable | Label | Error |
|---|---|---|---|---|---|---|---|---|---|---|
| dp1 | f1-1 | f2-1 | f3-1 | … | TM1() | ptv1-1 | plbl1 | tv1 | lbl1 | err1-1 |
| dp2 | f1-2 | f2-2 | f3-2 | … | TM1() | ptv1-2 | plbl1 | tv2 | lbl2 | err1-2 |
| dp3 | f1-3 | f2-3 | f3-3 | … | TM1() | ptv1-3 | plbl2 | tv3 | lbl3 | err1-3 |
| dp4 | f1-4 | f2-4 | f3-4 | … | TM1() | ptv1-4 | plbl3 | tv4 | lbl2 | err1-4 |
| dp5 | f1-5 | f2-5 | f3-5 | … | TM1() | ptv1-5 | plbl2 | tv5 | lbl4 | err1-5 |
| dp6 | f1-6 | f2-6 | f3-6 | … | TM1() | ptv1-6 | plbl4 | tv6 | lbl3 | err1-6 |
| etc. | etc. | etc. | etc. | etc. | etc. | etc. | etc. | etc. | etc. | etc. |
It then plugs those error values into some fancy-schmancy statistical equations to make adjustments to its trained model. Let’s call this new, adjusted model, TM2( ). Plugging in the same data points returns a new set of predicted target values and predicted labels:
TM2( f1-1, f2-1, f3-1, … ) = ptv2-1, plbl2
TM2( f1-2, f2-2, f3-2, … ) = ptv2-2, plbl2
TM2( f1-3, f2-3, f3-3, … ) = ptv2-3, plbl3
TM2( f1-4, f2-4, f3-4, … ) = ptv2-4, plbl3
TM2( f1-5, f2-5, f3-5, … ) = ptv2-5, plbl4
TM2( f1-6, f2-6, f3-6, … ) = ptv2-6, plbl1
etc.
This also produces a new set of errors, err2-1, err2-2, err2-3, etc. So, our table now looks like this:
TM( ) = ?plbl1, lbl1 → ( predicted ) target variable is less than the value a
plbl2, lbl2 → ( predicted ) target variable is between the values a and b
plbl3, lbl3 → ( predicted ) target variable is between the values b and c
plbl4, lbl4 → ( predicted ) target variable is greater than the value c
| Data Point | Feature 1 | Feature 2 | Feature 3 | … | TM( ) Used | Predicted Target Variable | Predicted Label | Target Variable | Label | Error |
|---|---|---|---|---|---|---|---|---|---|---|
| dp1 | f1-1 | f2-1 | f3-1 | … | TM2() | ptv2-1 | plbl2 | tv1 | lbl1 | err2-1 |
| dp2 | f1-2 | f2-2 | f3-2 | … | TM2() | ptv2-2 | plbl2 | tv2 | lbl2 | err2-2 |
| dp3 | f1-3 | f2-3 | f3-3 | … | TM2() | ptv2-3 | plbl3 | tv3 | lbl3 | err2-3 |
| dp4 | f1-4 | f2-4 | f3-4 | … | TM2() | ptv2-4 | plbl3 | tv4 | lbl2 | err2-4 |
| dp5 | f1-5 | f2-5 | f3-5 | … | TM2() | ptv2-5 | plbl4 | tv5 | lbl4 | err2-5 |
| dp6 | f1-6 | f2-6 | f3-6 | … | TM2() | ptv2-6 | plbl1 | tv6 | lbl3 | err2-6 |
| etc. | etc. | etc. | etc. | etc. | etc. | etc. | etc. | etc. | etc. | etc. |
The learning model takes the new error numbers and plugs them into the same fancy-schmancy statistical equations again in order to update its trained model once more. Let’s call this one, TM3( ). Plugging in the same data points produces a new set of predicted target values and predicted labels:
TM3( f1-1, f2-1, f3-1, … ) = ptv3-1, plbl2
TM3( f1-2, f2-2, f3-2, … ) = ptv3-2, plbl2
TM3( f1-3, f2-3, f3-3, … ) = ptv3-3, plbl3
TM3( f1-4, f2-4, f3-4, … ) = ptv3-4, plbl3
TM3( f1-5, f2-5, f3-5, … ) = ptv3-5, plbl4
TM3( f1-6, f2-6, f3-6, … ) = ptv3-6, plbl1
etc.
The learning model keeps repeating this process over and over, until:
- the final predicted target values are pretty close to the actual target values
- the final predicted labels match the actual labels
- the final error values are minimal
It ends up with the following:
TM( ) = TMfinal( )plbl1, lbl1 → ( predicted ) target variable is less than the value a
plbl2, lbl2 → ( predicted ) target variable is between the values a and b
plbl3, lbl3 → ( predicted ) target variable is between the values b and c
plbl4, lbl4 → ( predicted ) target variable is greater than the value c
| Data Point | Feature 1 | Feature 2 | Feature 3 | … | TM( ) Used | Predicted Target Variable | Predicted Label | Target Variable | Label | Error |
|---|---|---|---|---|---|---|---|---|---|---|
| dp1 | f1-1 | f2-1 | f3-1 | … | TMfinal() | ptvfinal-1 | plbl1 | tv1 | lbl1 | errfinal-1 |
| dp2 | f1-2 | f2-2 | f3-2 | … | TMfinal() | ptvfinal-2 | plbl2 | tv2 | lbl2 | errfinal-2 |
| dp3 | f1-3 | f2-3 | f3-3 | … | TMfinal() | ptvfinal-3 | plbl3 | tv3 | lbl3 | errfinal-3 |
| dp4 | f1-4 | f2-4 | f3-4 | … | TMfinal() | ptvfinal-4 | plbl2 | tv4 | lbl2 | errfinal-4 |
| dp5 | f1-5 | f2-5 | f3-5 | … | TMfinal() | ptvfinal-5 | plbl4 | tv5 | lbl4 | errfinal-5 |
| dp6 | f1-6 | f2-6 | f3-6 | … | TMfinal() | ptvfinal-6 | plbl3 | tv6 | lbl3 | errfinal-6 |
| etc. | etc. | etc. | etc. | etc. | etc. | etc. | etc. | etc. | etc. | etc. |
The learning model has settled on TMfinal( ).
And that’s pretty much supervised learning in a nutshell! Eazy-peezy, right?
I've Got Tone!
Okay, I’m a machine learning expert, but even I find what I’ve written to be complete gobbledygook!
So, let’s instead look at this from a different angle. What do we normally call supervised learning in our everyday conversations? You get a ginormous hint from the fact that a target variable does the supervising:
Yep, thaat’s riigghhtt! Supervised learning is just a really, really awkward way of saying target practice! Here’s an example.
You’re hanging out with your friends at a local bar. They introduce you to the game of darts. Since you’ve never played before, you do poorly. But your friends are very supportive, and you find yourself having a lot of fun.
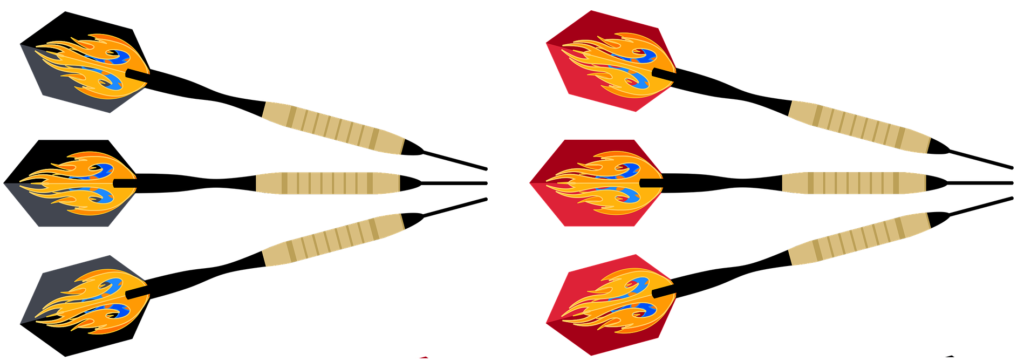
You decide to get better at this game, so you purchase some darts and a dartboard to practice at home.
Once you’ve set everything up, you’re ready to begin! Each data point represents a single practice throw.
| Practice Throw |
|---|
| pt1 |
| pt2 |
| pt3 |
| pt4 |
| pt5 |
| pt6 |
| etc. |
For each throw, the dart has to land somewhere. The target variable represents the landing spot, and each throw gets a unique target value.
| Practice Throw | Where Dart Lands (Target Variable) |
|---|---|
| pt1 | ? |
| pt2 | ? |
| pt3 | ? |
| pt4 | ? |
| pt5 | ? |
| pt6 | ? |
| etc. | etc. |
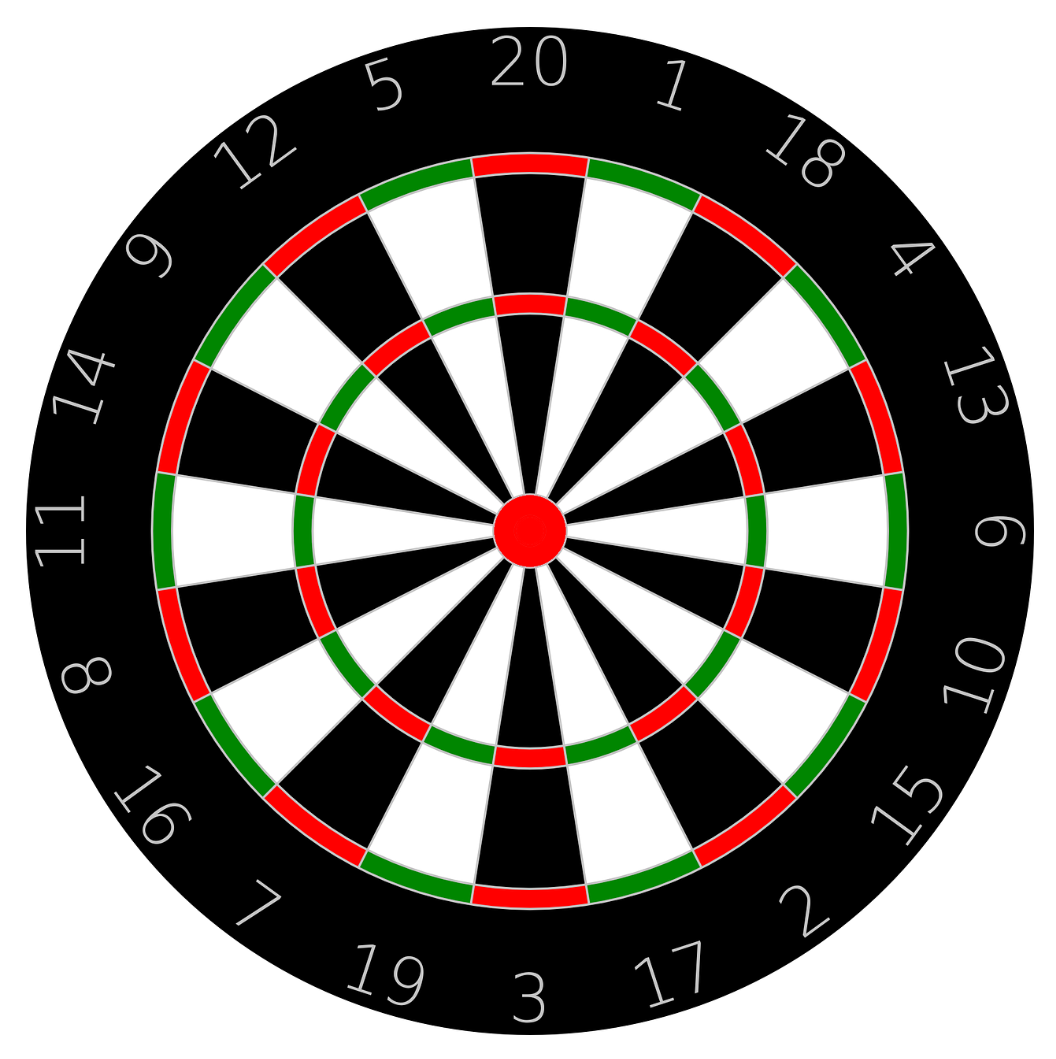
Let’s define this landing spot as the distance from the center of the dartboard. So, if the dart hits dead on center, the target value is zero. If the dart lands three inches from the center, then the target value equals three, and so on.
In addition, each throw has a label. Because you’re a beginner, you decide to keep things simple and use only two labels — BULLSEYE and NOT_BULLSEYE:
- BULLSEYE is defined as the dart hitting any spot within ¾ inch of the center
- NOT_BULLSEYE is for any location beyond ¾ inch.
These labels are colored as well. The dartboard conveniently color-codes the BULLSEYE region in red for us:
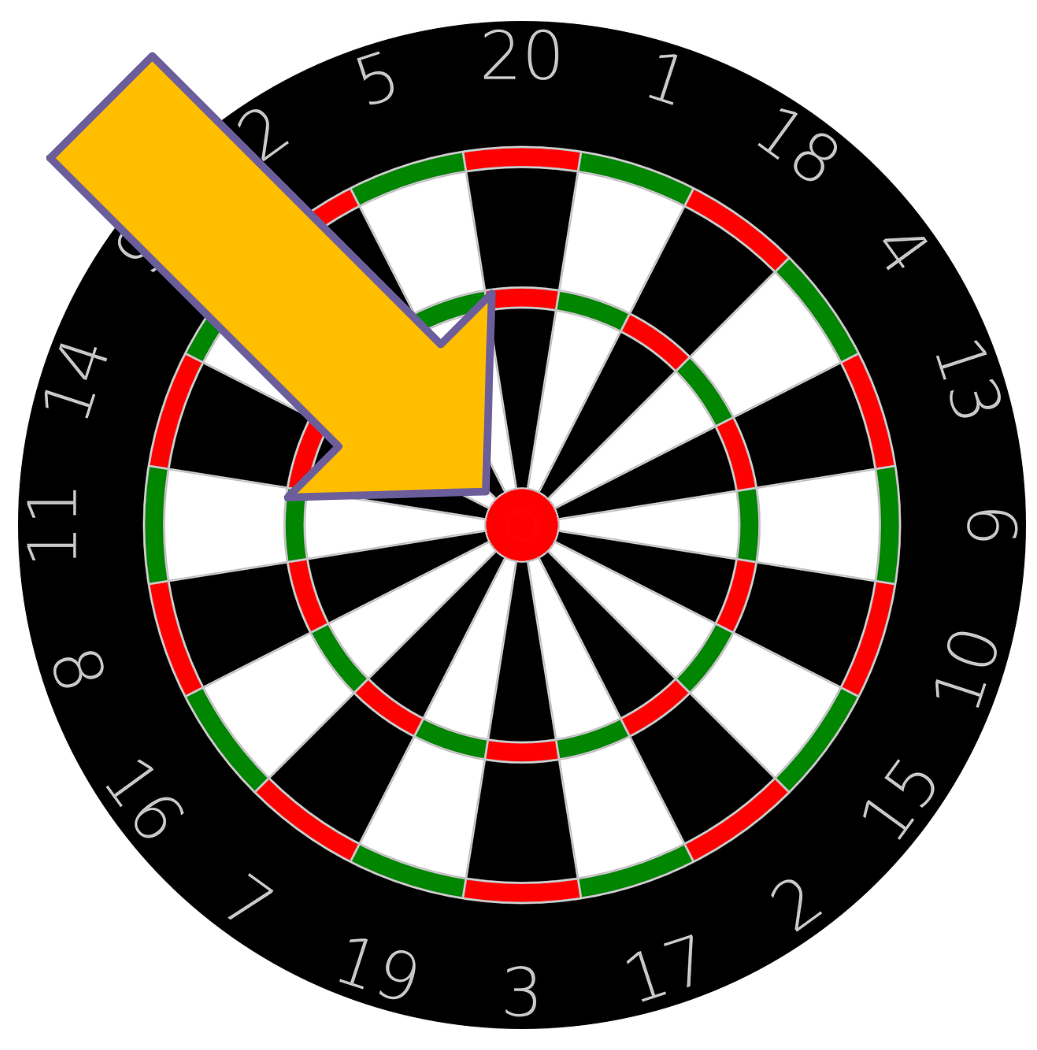
We’ll color the NOT_BULLSEYE area in blue.

So, we have:
NOT_BULLSEYE → target variable is greater than ¾ inch
| Practice Throw | Where Dart Lands (Target Variable) | Label |
|---|---|---|
| pt1 | ? | ? |
| pt2 | ? | ? |
| pt3 | ? | ? |
| pt4 | ? | ? |
| pt5 | ? | ? |
| pt6 | ? | ? |
| etc. | etc. | etc. |
Next, we need to look at all the hundreds of different factors that affect whether you hit the BULLSEYE or not, including:
- the horizontal angle of your shoulder
- the vertical angle of your shoulder
- the angle of your elbow
- the angle of your wrist
- how you hold the dart
- where you position each of your fingers
- the shape of the dart
- the weight of the dart
- how hard you throw the dart
- etc.
NOT_BULLSEYE → target variable is greater than ¾ inch
| Practice Throw | Horizontal Shoulder Angle | Vertical Shoulder Angle | Elbow Angle | Wrist Angle | How Hold Dart | Where Fingers Are Positioned | Dart Shape | Dart Weight | How Hard Throw Dart | … | Where Dart Lands (Target Variable) | Label |
|---|---|---|---|---|---|---|---|---|---|---|---|---|
| pt1 | ? | ? | ? | ? | ? | ? | ? | ? | ? | … | ? | ? |
| pt2 | ? | ? | ? | ? | ? | ? | ? | ? | ? | … | ? | ? |
| pt3 | ? | ? | ? | ? | ? | ? | ? | ? | ? | … | ? | ? |
| pt4 | ? | ? | ? | ? | ? | ? | ? | ? | ? | … | ? | ? |
| pt5 | ? | ? | ? | ? | ? | ? | ? | ? | ? | … | ? | ? |
| pt6 | ? | ? | ? | ? | ? | ? | ? | ? | ? | … | ? | ? |
| etc. | etc. | etc. | etc. | etc. | etc. | etc. | etc. | etc. | etc. | etc. | etc. | etc. |
Oh, my, that’s a lot of information to deal with! But you know what? Your amazing brain can effortlessly handle it all!
Unfortunately, because I’m explaining this with a pen-n-paper system ( more accurately, keyboard-n-screen ), I have to keep things simple and limit everything to just two factors: the horizontal angle of your shoulder and the vertical angle of your shoulder. We’ll assume that you’re able to keep all the other factors the same every single time, and that they don’t affect your throws in any way.
There’s a reason why you never hear of pen-n-paper learning systems. The processing power of a pen and a piece of paper is so limited that it can only handle easy toy problems.
NOT_BULLSEYE → target variable is greater than ¾ inch
| Practice Throw | Horizontal Shoulder Angle | Vertical Shoulder Angle | Where Dart Lands (Target Variable) | Label |
|---|---|---|---|---|
| pt1 | ? | ? | ? | ? |
| pt2 | ? | ? | ? | ? |
| pt3 | ? | ? | ? | ? |
| pt4 | ? | ? | ? | ? |
| pt5 | ? | ? | ? | ? |
| pt6 | ? | ? | ? | ? |
| etc. | etc. | etc. | etc. | etc. |
Let’s define:
- The horizontal
0°and the vertical0°position to be your arm extending out directly in front of you. - A
90°on the vertical is you raising your arm directly over your head. - A
-90°on the vertical is your arm by your side. - A
90°along the horizontal is your arm extended out parallel to your shoulders. - A
-90°along the horizontal is your arm extended across your chest. ( I know, I know, this is an impossible angle for your shoulder — but bear with me and pretend you’re as flexible as Gumby. )
Here are five spittin’ images of you holding your arm in those positions:
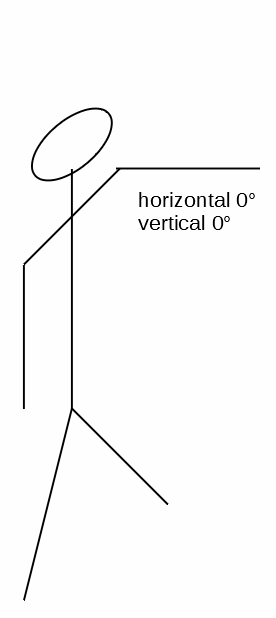
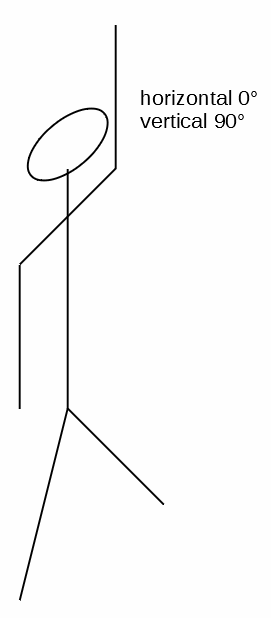
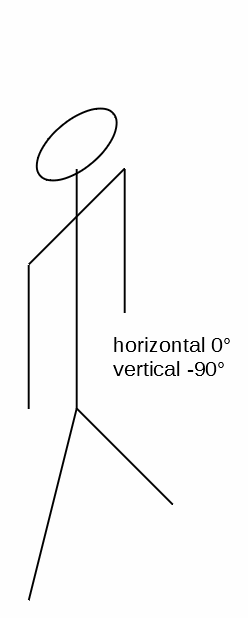
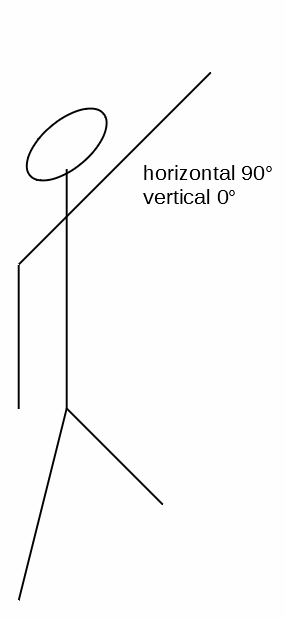
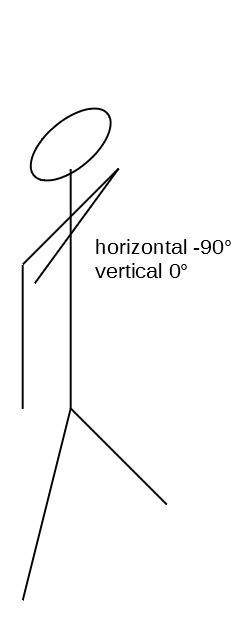
If you happen to be right-handed, then just hold your computer screen up to a mirror.
Okay, this particular supervised learning problem essentially boils down to the task where you, the learning model, needs to find a trained model that best describes the relationship between your two shoulder angles and where the dart will land. Figuring out this relationship is what you’re doing when you develop your dart throwing skill.
Let’s represent your skill with the function TM( ). Its parameters are your two shoulder angles, and its output is the dart’s landing spot: TM( horzn_angle, vert_angle ) = where_dart_lands
TM( ) = ?BULLSEYE → target variable is less than or equal to ¾ inch
NOT_BULLSEYE → target variable is greater than ¾ inch
| Practice Throw | Horizontal Shoulder Angle | Vertical Shoulder Angle | Where Dart Lands ( Target Variable ) | Label |
|---|---|---|---|---|
| pt1 | ? | ? | ? | ? |
| pt2 | ? | ? | ? | ? |
| pt3 | ? | ? | ? | ? |
| pt4 | ? | ? | ? | ? |
| pt5 | ? | ? | ? | ? |
| pt6 | ? | ? | ? | ? |
| etc. | etc. | etc. | etc. | etc. |
You begin with a random equation, TM1( ). And it truly is random, since you have no prior knowledge as to what TM( ) might look like.
Let’s say TM1( ) assumes that every single one of your throws will hit the center of the dartboard no matter what. So, the predicted target value of TM1( ) will always equal zero, and the predicted label will always be BULLSEYE:
TM1( hori_angle, vert_angle ) = 0, BULLSEYEYou step on the oche and ready your first throw. You set your horizontal shoulder angle to 0° and rotate your vertical shoulder angle to 90°. You let the dart fly, and … it hits the ceiling! It’s about eight feet ( 96 inches ) from the center of the dartboard. Definitely NOT_BULLSEYE.
TM(  ) = ?

TM1( hori_angle, vert_angle ) = 0, BULLSEYE always
BULLSEYE → ( predicted ) target variable is less than or equal to ¾ inch
NOT_BULLSEYE → ( predicted ) target variable is greater than ¾ inch
| Practice Throw | Horizontal Shoulder Angle | Vertical Shoulder Angle | TM( ) Used | Predicted Landing (Predicted Target Variable) | Predicted Label | Where Dart Lands (Target Variable) | Label |
|---|---|---|---|---|---|---|---|
| pt1 | 0 | 90 | TM1() | 0 | BULLSEYE | 96 | NOT_BULLSEYE |
| pt2 | ? | ? | ? | ? | ? | ? | ? |
| pt3 | ? | ? | ? | ? | ? | ? | ? |
| pt4 | ? | ? | ? | ? | ? | ? | ? |
| pt5 | ? | ? | ? | ? | ? | ? | ? |
| pt6 | ? | ? | ? | ? | ? | ? | ? |
| etc. | etc. | etc. | etc. | etc. | etc. | etc. | etc. |
You then rotate your arm down to -90° on the vertical, placing it by your side. You release the dart, and … it hits the floor — narrowly missing your pinky toe! Again, it’s about eight feet ( 96 inches ) from the center. Still NOT_BULLSEYE.
You next set your arm vertically at 0°, but rotate it out horizontally 90°. You throw, and … the dart hits the side wall. Also about eight feet ( 96 inches ), and yet again NOT_BULLSEYE.
You still believe in TM1( ), so you give it one more try. You rotate your arm horizontally across you chest to -90°, let the dart go, and … it hits the other side wall, about eight feet ( 96 inches ) away from the center. NOT_BULLSEYE once more.
This is what you have so far:
TM(  ) = ?

TM1( hori_angle, vert_angle ) = 0, BULLSEYE always
BULLSEYE → ( predicted ) target variable is less than or equal to ¾ inch
NOT_BULLSEYE → ( predicted ) target variable is greater than ¾ inch
| Practice Throw | Horizontal Shoulder Angle | Vertical Shoulder Angle | TM( ) Used | Predicted Landing (Predicted Target Variable) | Predicted Label | Where Dart Lands (Target Variable) | Label |
|---|---|---|---|---|---|---|---|
| pt1 | 0 | 90 | TM1() | 0 | BULLSEYE | 96 | NOT_BULLSEYE |
| pt2 | 0 | -90 | TM1() | 0 | BULLSEYE | 96 | NOT_BULLSEYE |
| pt3 | 90 | 0 | TM1() | 0 | BULLSEYE | 96 | NOT_BULLSEYE |
| pt4 | -90 | 0 | TM1() | 0 | BULLSEYE | 96 | NOT_BULLSEYE |
| pt5 | ? | ? | ? | ? | ? | ? | ? |
| pt6 | ? | ? | ? | ? | ? | ? | ? |
| etc. | etc. | etc. | etc. | etc. | etc. | etc. | etc. |
You’re forced to admit that TM1( ) is not accurate at all. You analyze how far off the mark you’ve been by calculating the error. For this problem, the error is simply the distance between where you predicted the dart would land and where it actually landed. In mathspeak, it’s the absolute value of the predicted target variable minus the actual target variable: | ptv - tv |.
TM(  ) = ?

TM1( hori_angle, vert_angle ) = 0, BULLSEYE always
BULLSEYE → ( predicted ) target variable is less than or equal to ¾ inch
NOT_BULLSEYE → ( predicted ) target variable is greater than ¾ inch
| Practice Throw | Horizontal Shoulder Angle | Vertical Shoulder Angle | TM( ) Used | Predicted Landing (Predicted Target Variable) | Predicted Label | Where Dart Lands (Target Variable) | Label | Error |
|---|---|---|---|---|---|---|---|---|
| pt1 | 0 | 90 | TM1() | 0 | BULLSEYE | 96 | NOT_BULLSEYE | 96 |
| pt2 | 0 | -90 | TM1() | 0 | BULLSEYE | 96 | NOT_BULLSEYE | 96 |
| pt3 | 90 | 0 | TM1() | 0 | BULLSEYE | 96 | NOT_BULLSEYE | 96 |
| pt4 | -90 | 0 | TM1() | 0 | BULLSEYE | 96 | NOT_BULLSEYE | 96 |
| pt5 | ? | ? | ? | ? | ? | ? | ? | ? |
| pt6 | ? | ? | ? | ? | ? | ? | ? | ? |
| etc. | etc. | etc. | etc. | etc. | etc. | etc. | etc. | etc. |
At this point, the machine learning algorithm in your head adjusts TM1( ) by feeding the errors into a couple of fancy-schmancy statistical equations that came pre-natally installed in your brain. Let’s call your updated skill, TM2( ), and let’s say it assumes that you’ll hit dead on center when the magnitudes of both of your shoulder angles are less than 45°, but that you’ll miss by two inches when the magnitude of either angle is greater than 45°.
Here are the results of your next few throws:
TM(  ) = ?

TM2(  ) = 0, BULLSEYE when both hori_angle and vert_angle < 45°,

         2, NOT_BULLSEYE when either hori_angle or vert_angle ≥ 45°
BULLSEYE → ( predicted ) target variable is less than or equal to ¾ inch
NOT_BULLSEYE → ( predicted ) target variable is greater than ¾ inch
| Practice Throw | Horizontal Shoulder Angle | Vertical Shoulder Angle | TM( ) Used | Predicted Landing (Predicted Target Variable) | Predicted Label | Where Dart Lands (Target Variable) | Label | Error |
|---|---|---|---|---|---|---|---|---|
| pt1 | 0 | 90 | TM1() | 0 | BULLSEYE | 96 | NOT_BULLSEYE | 96 |
| pt2 | 0 | -90 | TM1() | 0 | BULLSEYE | 96 | NOT_BULLSEYE | 96 |
| pt3 | 90 | 0 | TM1() | 0 | BULLSEYE | 96 | NOT_BULLSEYE | 96 |
| pt4 | -90 | 0 | TM1() | 0 | BULLSEYE | 96 | NOT_BULLSEYE | 96 |
| pt5 | 0 | 60 | TM2() | 2 | NOT_BULLSEYE | 37 | NOT_BULLSEYE | 35 |
| pt6 | 0 | -60 | TM2() | 2 | NOT_BULLSEYE | 37 | NOT_BULLSEYE | 35 |
| pt7 | 60 | 0 | TM2() | 2 | NOT_BULLSEYE | 37 | NOT_BULLSEYE | 35 |
| pt8 | -60 | 0 | TM2() | 2 | NOT_BULLSEYE | 37 | NOT_BULLSEYE | 35 |
| pt9 | 0 | 30 | TM2() | 0 | BULLSEYE | 9 | NOT_BULLSEYE | 9 |
| pt10 | 0 | -30 | TM2() | 0 | BULLSEYE | 9 | NOT_BULLSEYE | 9 |
| pt11 | 30 | 0 | TM2() | 0 | BULLSEYE | 9 | NOT_BULLSEYE | 9 |
| pt12 | -30 | 0 | TM2() | 0 | BULLSEYE | 9 | NOT_BULLSEYE | 9 |
| pt13 | ? | ? | ? | ? | ? | ? | ? | ? |
| pt14 | ? | ? | ? | ? | ? | ? | ? | ? |
| etc. | etc. | etc. | etc. | etc. | etc. | etc. | etc. | etc. |
The errors are smaller, but there’s still a lot of room for improvement. The good news, though, is that for practice throws five thru eight, you did not expect to hit the bullseye — which matched what actually happened. So, a tiny bit of progress!
You repeat the process over and over, improving your trained model every few throws — until by the 100th throw and the 14th update to your skill, you get the following:
TM( ) = TM14( )BULLSEYE → ( predicted ) target variable is less than or equal to ¾ inch
NOT_BULLSEYE → ( predicted ) target variable is greater than ¾ inch
| Practice Throw | Horizontal Shoulder Angle | Vertical Shoulder Angle | TM( ) Used | Predicted Landing (Predicted Target Variable) | Predicted Label | Where Dart Lands (Target Variable) | Label | Error |
|---|---|---|---|---|---|---|---|---|
| pt1 | 0 | 90 | TM1() | 0 | BULLSEYE | 96 | NOT_BULLSEYE | 96 |
| pt2 | 0 | -90 | TM1() | 0 | BULLSEYE | 96 | NOT_BULLSEYE | 96 |
| pt3 | 90 | 0 | TM1() | 0 | BULLSEYE | 96 | NOT_BULLSEYE | 96 |
| pt4 | -90 | 0 | TM1() | 0 | BULLSEYE | 96 | NOT_BULLSEYE | 96 |
| pt5 | 0 | 60 | TM2() | 2 | NOT_BULLSEYE | 37 | NOT_BULLSEYE | 35 |
| pt6 | 0 | -60 | TM2() | 2 | NOT_BULLSEYE | 37 | NOT_BULLSEYE | 35 |
| pt7 | 60 | 0 | TM2() | 2 | NOT_BULLSEYE | 37 | NOT_BULLSEYE | 35 |
| pt8 | -60 | 0 | TM2() | 2 | NOT_BULLSEYE | 37 | NOT_BULLSEYE | 35 |
| pt9 | 0 | 30 | TM2() | 0 | BULLSEYE | 9 | NOT_BULLSEYE | 9 |
| pt10 | 0 | -30 | TM2() | 0 | BULLSEYE | 9 | NOT_BULLSEYE | 9 |
| pt11 | 30 | 0 | TM2() | 0 | BULLSEYE | 9 | NOT_BULLSEYE | 9 |
| pt12 | -30 | 0 | TM2() | 0 | BULLSEYE | 9 | NOT_BULLSEYE | 9 |
| … | … | … | … | … | … | … | … | … |
| pt27 | 14 | 3 | TM6() | 0.2 | BULLSEYE | 7 | NOT_BULLSEYE | 6.8 |
| pt28 | 12 | 25 | TM6() | 5 | NOT_BULLSEYE | 13 | NOT_BULLSEYE | 8 |
| pt29 | -20 | 14 | TM6() | 0.2 | BULLSEYE | 5 | NOT_BULLSEYE | 4.8 |
| pt30 | -16 | -2 | TM6() | 0.1 | BULLSEYE | 6 | NOT_BULLSEYE | 5.9 |
| … | … | … | … | … | … | … | … | … |
| pt58 | -2 | 3 | TM10() | 0.3 | BULLSEYE | 1 | NOT_BULLSEYE | 0.7 |
| pt59 | 8 | -4 | TM10() | 0.5 | BULLSEYE | 0.15 | BULLSEYE | 0.35 |
| pt60 | 1 | 2 | TM10() | 0.1 | BULLSEYE | 0.2 | BULLSEYE | 0.1 |
| pt61 | 0 | -3 | TM10() | 3 | BULLSEYE | 4 | NOT_BULLSEYE | 1 |
| … | … | … | … | … | … | … | … | … |
| pt96 | 1 | -1 | TM14() | 0.1 | BULLSEYE | 0.2 | BULLSEYE | 0.1 |
| pt97 | -2 | 1 | TM14() | 0.1 | BULLSEYE | 0.7 | NOT_BULLSEYE | 0.6 |
| pt98 | 4 | -5 | TM14() | 0.2 | BULLSEYE | 0.15 | BULLSEYE | 0.05 |
| pt99 | 8 | 7 | TM14() | 0.8 | NOT_BULLSEYE | 0.6 | NOT_BULLSEYE | 0.2 |
| pt100 | -6 | 2 | TM14() | 0.2 | BULLSEYE | 0.1 | BULLSEYE | 0.1 |
It’s starting to look pretty good. You’ve managed to hit the bullseye a number of times, and for the times you didn’t, you expected to miss. You decide that TM14( ) is accurate enough. You could continue, but your arm is starting to feel like spaghetti.
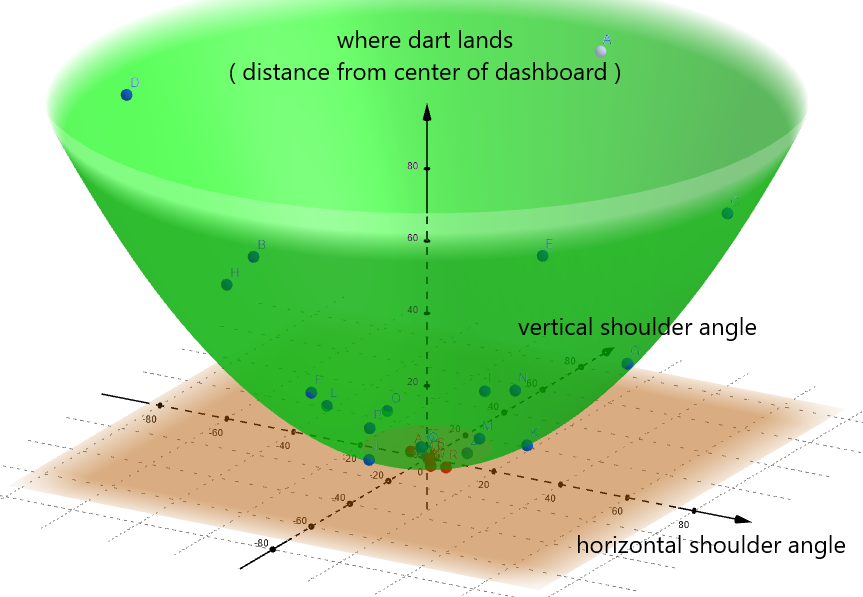
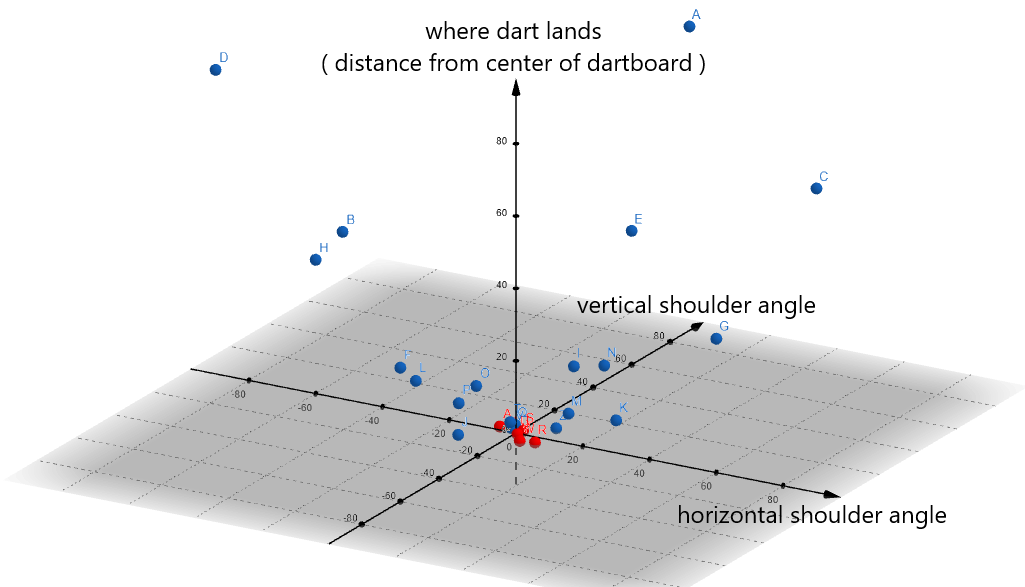
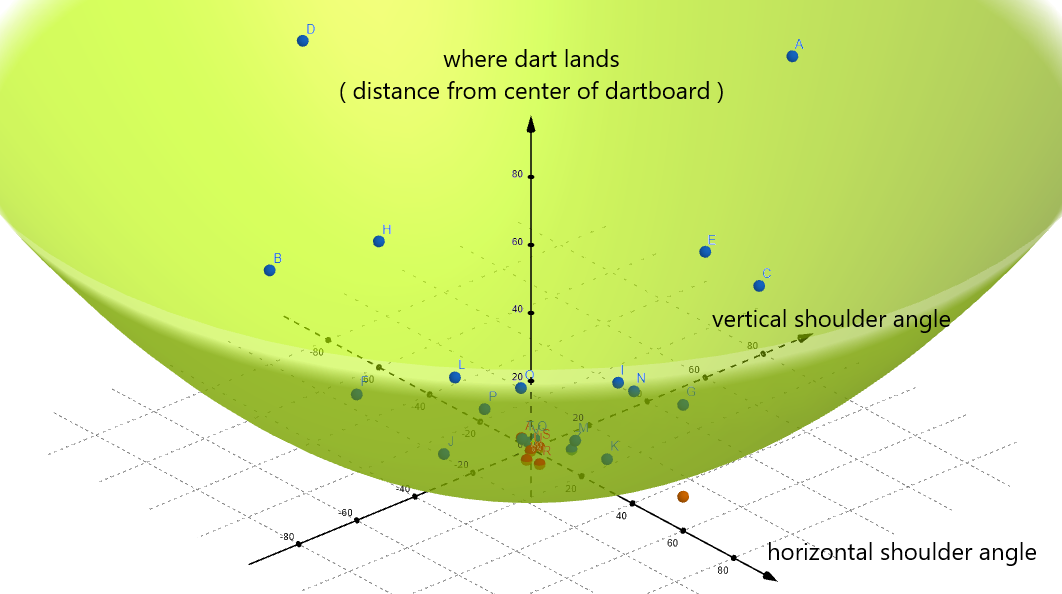
Your brain stores a representation of TM14( ) in a biochemical format, and does it in a way that allows it to quickly and easily plug in new shoulder angles to accurately predict where the dart will land. Unfortunately, for the reason once again that we’re using a pen-n-paper system, we need to write out TM14( ) in a much less efficient form — as a mathematical equation. Let’s get a rough idea of what the equation looks like by plotting out the data and eyeballing it on a graph.
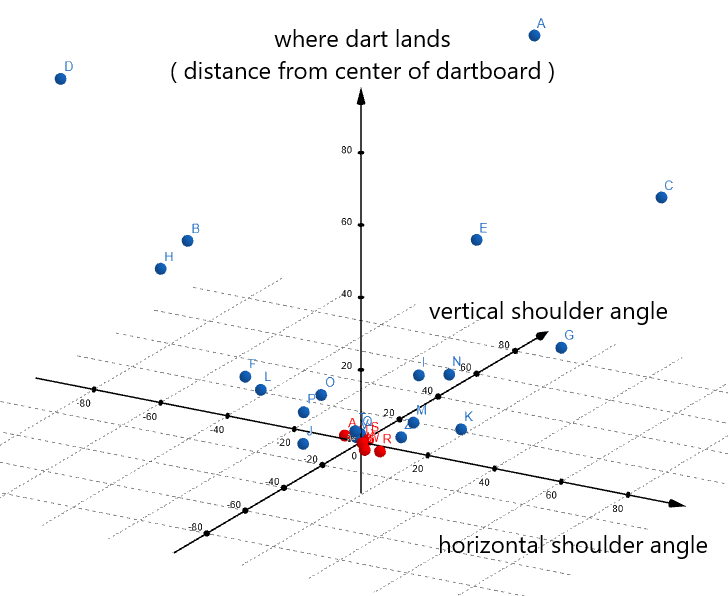
Seems like your throws are tracing out a paraboloid pattern.
ax2 + by2 + c = z, where a, b, and c are constants. If we plug in our feature variables, TM14( ) probably looks something like:a * ( horzn_angle )2 + b * ( vert_angle )2 + c = where_dart_landsYou would use some fancy math to determine what a, b, and c are.
Basically, the equation is saying that the wider the angles your shoulder takes, the farther the dart will land from the center. Which makes sense.
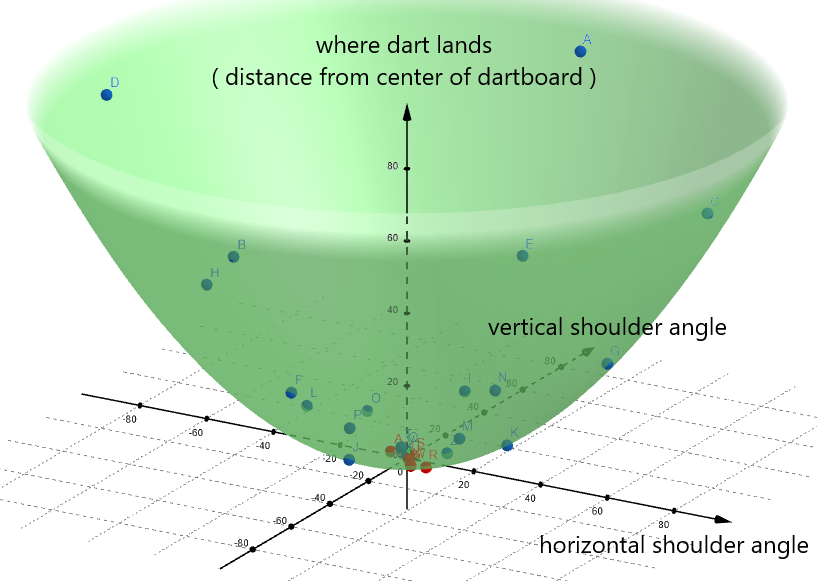
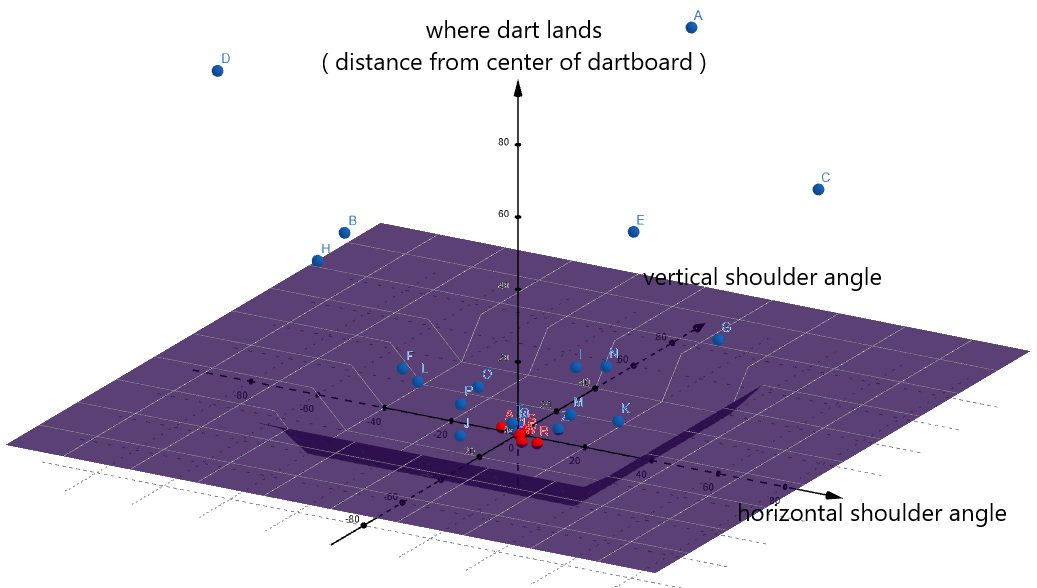
We can even use the graph to predict labels. We’ll represent the label definitions like this:
A flat plane ( colored brown in the above image ) slices through the paraboloid where the target variable equals 0.75 inches. Any point below this plane is labeled BULLSEYE, and any point above it is labeled NOT_BULLSEYE.
This tells us that if we want to hit the BULLSEYE, we need to keep our shoulder angles as close to 0° as possible in order to maximize our chances. Which also makes sense.
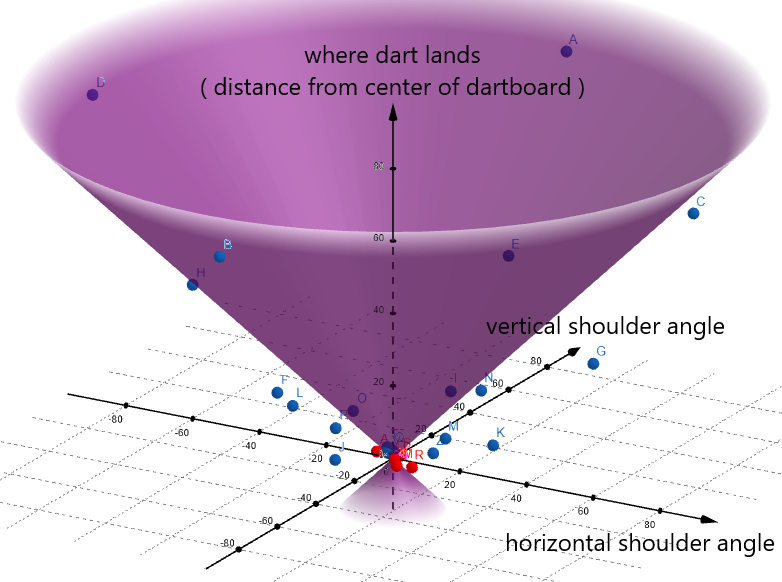
For comparison, this is what TM1( ) looks like on a graph:
It’s also a flat plane, but it sits on the xy-axes, where the target variable always equals zero.
Here’s TM2( ):
TM3( ) maybe took this form:
TM4( ) may have looked like this:
As you can see, when you update your trained model, you are essentially molding it like clay until it wraps as tightly around the data points as possible.
And that’s pretty much supervised learning in a nutshell! Eazy-peezy, right?
The next time you meet your friends, you decide to impress them with your newly minted trained model. And boy, are they impressed! You manage to hit the bullseye in eight of ten throws. They especially like how you exponentiate your shoulder angles — it really accentuates your eyes.
Features To Right Of You,
Features To Left Of You,
Features In Front Of You!
One final note — in the real world, machine learning systems have to deal with hundreds, thousands, even millions of features. Many may seem at first glance to impact the target variable in some way. But only on closer inspection would one realize that they don’t actually have any effect at all. For example, wind could potentially affect your dart throws. But since you’re practicing indoors, probably not. While your brain is very good at weeding out irrelevant details, machine learning algorithms need a little help.
Fortunately, there are a whole bunch of tools like feature selection, principle component analysis ( PCA ), linear discriminant analysis ( LDA ), etc., that can help filter out the useless features from the truly impactful ones.
Congratulations! Now that you understand supervised learning, you graduate from the Cool Kidz Academy School for Cool Kidz! As a graduation gift, here are a pair of shades and some ice cubes to complete your look.