
If supervised learning is target practice, then what is unsupervised learning? Well, these are learning problems where the training data have no target values nor labels — hence they’re unsupervised.
Using the dart throwing example, it’d be like throwing darts without a dartboard. Wait, what? If you have nothing to aim at, then what’s the point? Exactly! There is no point! Unsupervised learning is completely useless.
Just like art.
Ha, ha, just kidding! It’s a joke, it’s a joke! For heaven’s sake, all you art majors put your pitchforks down! Jeez-louize! What a sensitive crowd!
School's Out For The Summer!
Because the training data have no target values, it is up to you as the learning model to provide the values. And if the situation warrants, the labels as well. Whereas supervised learning allows for only one particular set of answers, unsupervised learning pretty much accepts any answer you give.
TM( ) = ?BULLSEYE → target variable is ?
NOT_BULLSEYE → target variable is ?
| Practice Throw | Horizontal Shoulder Angle | Vertical Shoulder Angle | TM( ) Used | Predicted Landing (Predicted Target Variable) | Predicted Label | Where Dart Lands (Target Variable) | Label | Error |
|---|---|---|---|---|---|---|---|---|
| pt1 | 14 | 3 | TM1() | n/a | n/a | ? | ? | n/a |
| pt2 | 12 | 25 | TM1() | n/a | n/a | ? | ? | n/a |
| pt3 | -20 | 14 | TM1() | n/a | n/a | ? | ? | n/a |
| pt4 | -16 | -2 | TM1() | n/a | n/a | ? | ? | n/a |
| pt5 | -2 | 3 | TM1() | n/a | n/a | ? | ? | n/a |
| pt6 | 9 | -30 | TM1() | n/a | n/a | ? | ? | n/a |
| pt7 | -17 | 2 | TM1() | n/a | n/a | ? | ? | n/a |
| pt8 | 1 | 0 | TM1() | n/a | n/a | ? | ? | n/a |
| pt9 | 1 | -1 | TM1() | n/a | n/a | ? | ? | n/a |
| pt10 | -2 | 1 | TM1() | n/a | n/a | ? | ? | n/a |
| pt11 | 4 | -5 | TM1() | n/a | n/a | ? | ? | n/a |
| pt12 | 8 | 7 | TM1() | n/a | n/a | ? | ? | n/a |
| etc. | etc. | etc. | etc. | etc. | etc. | etc. | etc. | etc. |
Hmm, let’s see here … . How about we label the darts this way?
TM( ) = TM1( )BULLSEYE → target variable is less than or equal to the size of the room
NOT_BULLSEYE → target variable is greater than the size of the room
| Practice Throw | Horizontal Shoulder Angle | Vertical Shoulder Angle | TM( ) Used | Predicted Landing (Predicted Target Variable) | Predicted Label | Where Dart Lands (Target Variable) | Label | Error |
|---|---|---|---|---|---|---|---|---|
| pt1 | 14 | 3 | TM1() | n/a | n/a | 7 | BULLSEYE | n/a |
| pt2 | 12 | 25 | TM1() | n/a | n/a | 3 | BULLSEYE | n/a |
| pt3 | -20 | 14 | TM1() | n/a | n/a | 12 | BULLSEYE | n/a |
| pt4 | -16 | -2 | TM1() | n/a | n/a | 5 | BULLSEYE | n/a |
| pt5 | -2 | 3 | TM1() | n/a | n/a | 8 | BULLSEYE | n/a |
| pt6 | 9 | -30 | TM1() | n/a | n/a | 11 | BULLSEYE | n/a |
| pt7 | -17 | 2 | TM1() | n/a | n/a | 1 | BULLSEYE | n/a |
| pt8 | 1 | 0 | TM1() | n/a | n/a | 0.4 | BULLSEYE | n/a |
| pt9 | 1 | -1 | TM1() | n/a | n/a | 3 | BULLSEYE | n/a |
| pt10 | -2 | 1 | TM1() | n/a | n/a | 6 | BULLSEYE | n/a |
| pt11 | 4 | -5 | TM1() | n/a | n/a | 9 | BULLSEYE | n/a |
| pt12 | 8 | 7 | TM1() | n/a | n/a | 7 | BULLSEYE | n/a |
| etc. | etc. | etc. | etc. | etc. | etc. | etc. | etc. | etc. |
Wow, you’re a dart throwing champion! This is literally the definition of a participation trophy!
But, hold on! Before you jump for joy and start chanting, “Woo-hoo! No more pencils, no more books, no more teachers’ dirty looks! … ,” you need to understand that this task isn’t as easy as it seems.
You’re puzzled. “How is this not easy? If any answer is acceptable, then for each data point I can simply assign an arbitrary target value, slap on a random label, and then call it a day!”
Well, technically, yes. While there are no right or wrong answers, the point of machine learning is to detect patterns. Arbitrary values and random labels are not patterns. Finding patterns means that you need to learn what the relationships among the data points are and then assign target values and labels that explicitly describe those relationships.
You become dejected. “So, even when there’s nothing to learn, we still have to learn?”
Yes.
It's Complicated
Unfortunately, rarely will you ever find simple datasets where each data point has only one type of relationship with other data points. Most data come with a whole host of features, traits, and characteristics. Data points will almost always have a diversed variety of relationships with one another. For example, let’s take a look at the demographic data of the people living in your neighborhood. We can break them down by age, gender, race, and occupation:
| Person | Age | Gender | Race | Occupation |
|---|---|---|---|---|
| person1 | 17 | male | white | high school student |
| person2 | 26 | female | brown | artist |
| person3 | 11 | female | black | elementary school student |
| person4 | 56 | male | yellow | neurosurgeon |
| person5 | 35 | female | sunshine | salesperson |
| person6 | 162 | male | gold | youth counselor |
| person7 | 32 | male | green | farmer |
| person8 | 87 | female | purple | amethyst collector |
| person9 | 45 | female | wisteria | botanist |
| person10 | 28 | it | chrome | cybernetics engineer |
| etc. | etc. | etc. | etc. | etc. |
And from their social networking profiles, we also have data on who’s friends with whom:
| Person | Age | Gender | Race | Occupation | Friends |
|---|---|---|---|---|---|
| person1 | 17 | male | white | high school student | group1 |
| person2 | 26 | female | brown | artist | group2 |
| person3 | 11 | female | black | elementary school student | group1 |
| person4 | 56 | male | yellow | neurosurgeon | group2 |
| person5 | 35 | female | sunshine | salesperson | group2 |
| person6 | 162 | male | gold | youth counselor | group3 |
| person7 | 32 | male | green | farmer | group4 |
| person8 | 87 | female | purple | amethyst collector | group5 |
| person9 | 45 | female | wisteria | botanist | group3 |
| person10 | 28 | it | chrome | cybernetics engineer | group6 |
| etc. | etc. | etc. | etc. | etc. | etc. |
Say you want to build a recommender system that suggests movies to each person. You can use the demographic information to determine what people of similar age, race, gender, and occupation often watch and make recommendations based on that:
| Person | Age | Gender | Race | Occupation | Friends | Label |
|---|---|---|---|---|---|---|
| person1 | 17 | male | white | high school student | group1 | Friday Night Lights |
| person2 | 26 | female | brown | artist | group2 | Sisterhood of the Traveling Pants |
| person3 | 11 | female | black | elementary school student | group1 | My Little Pony: The Movie |
| person4 | 56 | male | yellow | neurosurgeon | group2 | The Theory of Everything |
| person5 | 35 | female | sunshine | salesperson | group2 | Rachel Ray Presents |
| person6 | 162 | male | gold | youth counselor | group3 | Methusaleh |
| person7 | 32 | male | green | farmer | group4 | Star Trek: To Andromeda! |
| person8 | 87 | female | purple | amethyst collector | group5 | Barney |
| person9 | 45 | female | wisteria | botanist | group3 | Desperate Housewives: More Desperate Than Ever |
| person10 | 28 | it | chrome | cybernetics engineer | group6 | Pinocchio |
| etc. | etc. | etc. | etc. | etc. | etc. | etc. |
Or, you can make suggestions based on what their friends have watched.
| Person | Age | Gender | Race | Occupation | Friends | Label |
|---|---|---|---|---|---|---|
| person1 | 17 | male | white | high school student | group1 | Diary of a Wimpy Kid |
| person2 | 26 | female | brown | artist | group2 | Shaun of the Dead |
| person3 | 11 | female | black | elementary school student | group1 | Diary of a Wimpy Kid |
| person4 | 56 | male | yellow | neurosurgeon | group2 | Shaun of the Dead |
| person5 | 35 | female | sunshine | salesperson | group2 | Shaun of the Dead |
| person6 | 162 | male | gold | youth counselor | group3 | Fast Times at Richmond High: The New Class |
| person7 | 32 | male | green | farmer | group4 | A Christmas Carol |
| person8 | 87 | female | purple | amethyst collector | group5 | Searching for Bobby Fisher |
| person9 | 45 | female | wisteria | botanist | group3 | Fast Times at Richmond High: The New Class |
| person10 | 28 | it | chrome | cybernetics engineer | group6 | Bridges of Madison County |
| etc. | etc. | etc. | etc. | etc. | etc. | etc. |
As you can see, by using different criteria, you end up with a completely different set of recommendations. The more relationships you unearth, the more labels you can potentially assign. While unsupervised learning isn’t random, it’s still very subjective.
Whereas supervised learning has tools such as feature selection, principal component analysis ( PCA ), linear discriminant analysis ( LDA ), etc., to filter out unnecessary features, unsupervised learning offers no such options. What features you emphasis depends ultimately on what you consider important. The second recommender system, for example, considers friendships more important than identity.
A Beautiful Mind
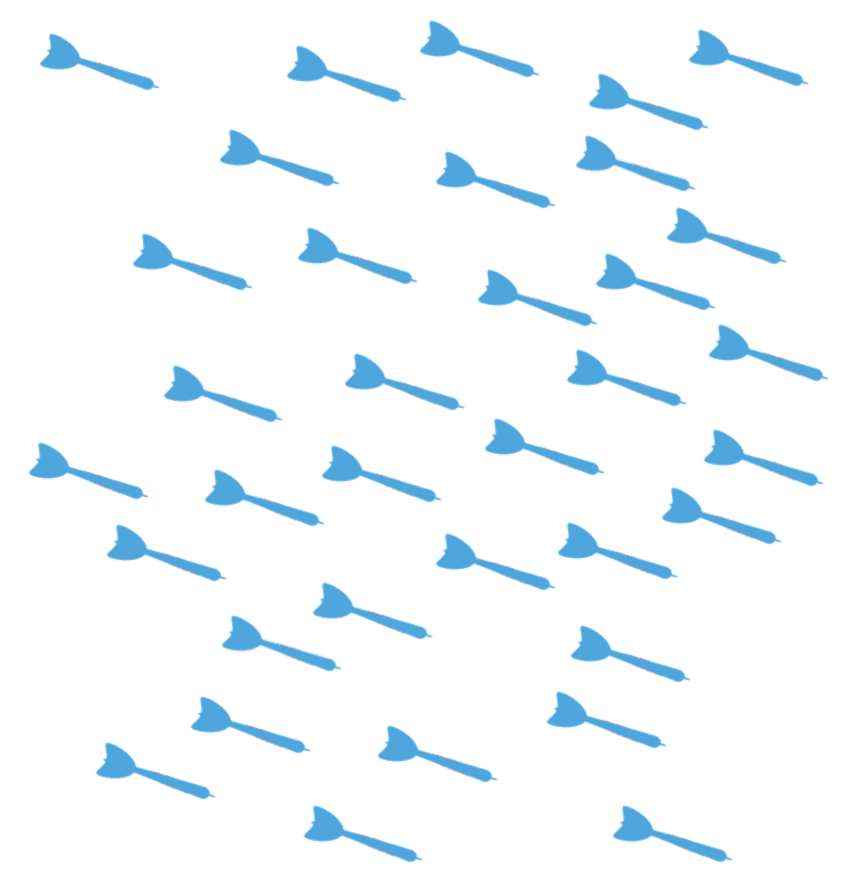
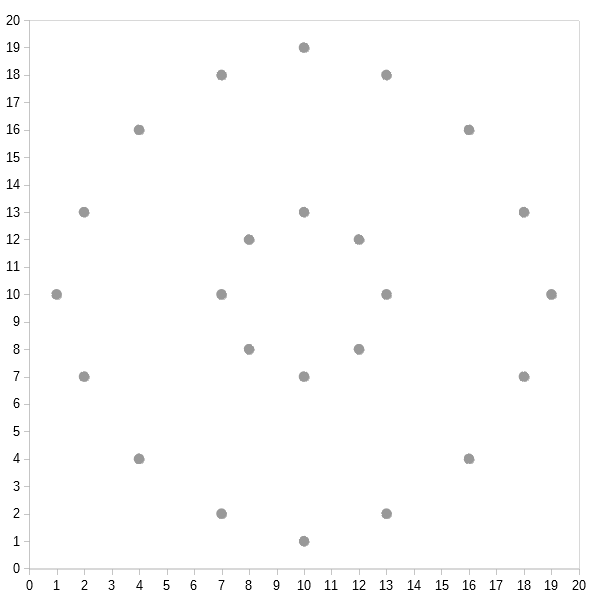
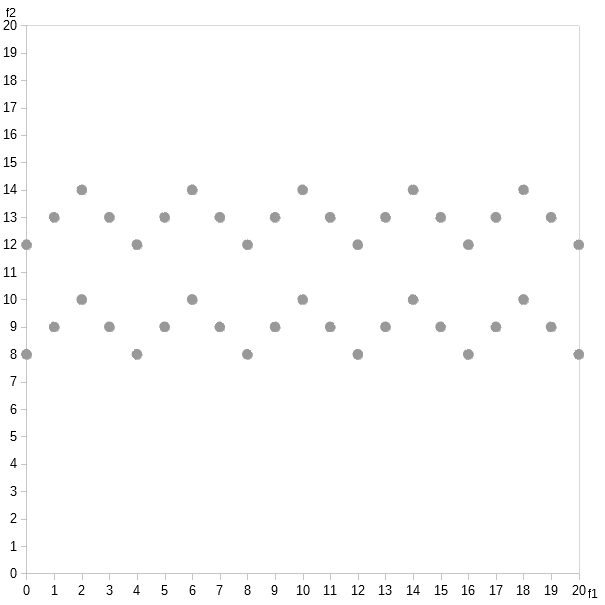
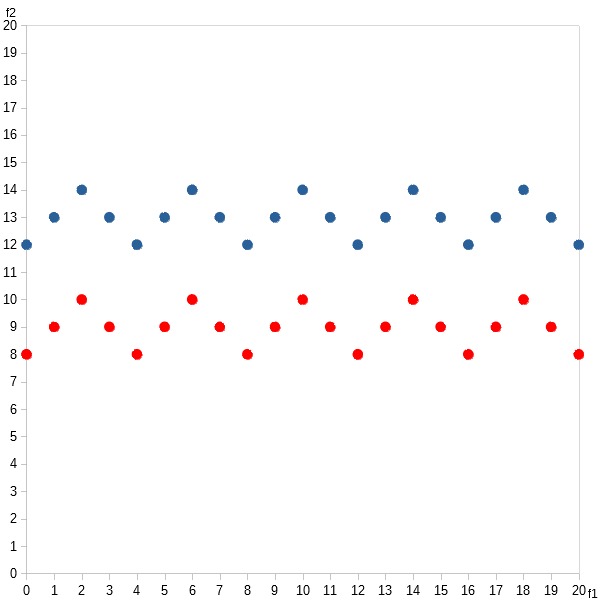
Here’s a new dataset and its corresponding graph.
| Data Point | Feature 1 | Feature 2 |
|---|---|---|
| dp1 | 3 | 2 |
| dp2 | 6 | 9 |
| dp3 | 2 | 19 |
| dp4 | 18 | 19 |
| dp5 | 17 | 2 |
| dp6 | 14 | 9 |
| dp7 | 10 | 9 |
| dp8 | 10 | 6 |
| dp9 | 10 | 11 |
| dp10 | 8 | 3 |
| dp11 | 9 | 5 |
| dp12 | 11 | 5 |
| dp13 | 12 | 3 |
| dp14 | 7 | 9 |
| dp15 | 13 | 9 |
| dp16 | 7 | 18 |
| dp17 | 13 | 18 |
| dp18 | 2 | 13 |
| dp19 | 18 | 13 |
| dp20 | 3 | 4 |
| dp21 | 17 | 4 |
| dp22 | 9 | 14 |
| dp23 | 11 | 14 |
| dp24 | 2 | 16 |
| dp25 | 18 | 16 |
| dp26 | 4 | 7 |
| dp27 | 16 | 7 |
| dp28 | 3 | 11 |
| dp29 | 17 | 11 |
| dp30 | 15 | 19 |
| dp31 | 5 | 19 |
| dp32 | 10 | 13 |
| dp33 | 6 | 2 |
| dp34 | 14 | 2 |
| dp35 | 8 | 16 |
| dp36 | 12 | 16 |
| dp37 | 8 | 11 |
| dp38 | 12 | 11 |
| dp39 | 8 | 7 |
| dp40 | 12 | 7 |
| dp41 | 5 | 17 |
| dp42 | 8 | 13 |
| dp43 | 12 | 13 |
| dp44 | 15 | 17 |
| dp45 | 3 | 15 |
| dp46 | 6 | 12 |
| dp47 | 13 | 16 |
| dp48 | 17 | 15 |
| dp49 | 3 | 17 |
| dp50 | 16 | 13 |
| dp51 | 4 | 13 |
| dp52 | 7 | 16 |
| dp53 | 17 | 17 |
| dp54 | 14 | 12 |
| dp55 | 6 | 5 |
| dp56 | 14 | 5 |
| dp57 | 5 | 4 |
| dp58 | 15 | 4 |
| dp59 | 2 | 9 |
| dp60 | 18 | 9 |
| dp61 | 10 | 17 |
| dp62 | 10 | 2 |
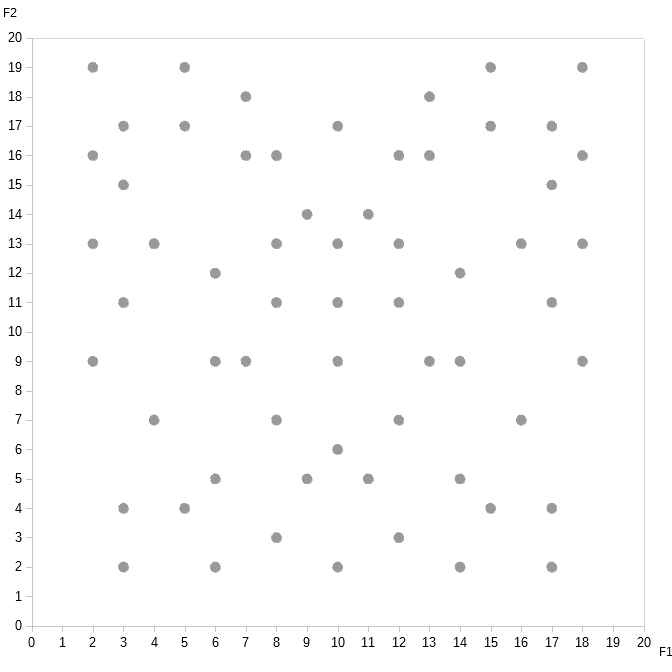
Do you notice the pattern?
How about if I label the data points this way:
| Data Point | Feature 1 | Feature 2 | Label |
|---|---|---|---|
| dp1 | 3 | 2 | 1 |
| dp2 | 6 | 9 | 1 |
| dp3 | 2 | 19 | 1 |
| dp4 | 18 | 19 | 1 |
| dp5 | 17 | 2 | 1 |
| dp6 | 14 | 9 | 1 |
| dp7 | 10 | 9 | 1 |
| dp8 | 10 | 6 | 1 |
| dp9 | 10 | 11 | 1 |
| dp10 | 8 | 3 | 1 |
| dp11 | 9 | 5 | 1 |
| dp12 | 11 | 5 | 1 |
| dp13 | 12 | 3 | 1 |
| dp14 | 7 | 9 | 1 |
| dp15 | 13 | 9 | 1 |
| dp16 | 7 | 18 | 1 |
| dp17 | 13 | 18 | 1 |
| dp18 | 2 | 13 | 1 |
| dp19 | 18 | 13 | 1 |
| dp20 | 3 | 4 | 1 |
| dp21 | 17 | 4 | 1 |
| dp22 | 9 | 14 | 1 |
| dp23 | 11 | 14 | 1 |
| dp24 | 2 | 16 | 1 |
| dp25 | 18 | 16 | 1 |
| dp26 | 4 | 7 | 1 |
| dp27 | 16 | 7 | 1 |
| dp28 | 3 | 11 | 1 |
| dp29 | 17 | 11 | 1 |
| dp30 | 15 | 19 | 1 |
| dp31 | 5 | 19 | 1 |
| dp32 | 10 | 13 | 1 |
| dp33 | 6 | 2 | 1 |
| dp34 | 14 | 2 | 1 |
| dp35 | 8 | 16 | 1 |
| dp36 | 12 | 16 | 1 |
| dp37 | 8 | 11 | -1 |
| dp38 | 12 | 11 | -1 |
| dp39 | 8 | 7 | -1 |
| dp40 | 12 | 7 | -1 |
| dp41 | 5 | 17 | -1 |
| dp42 | 8 | 13 | -1 |
| dp43 | 12 | 13 | -1 |
| dp44 | 15 | 17 | -1 |
| dp45 | 3 | 15 | -1 |
| dp46 | 6 | 12 | -1 |
| dp47 | 13 | 16 | -1 |
| dp48 | 17 | 15 | -1 |
| dp49 | 3 | 17 | -1 |
| dp50 | 16 | 13 | -1 |
| dp51 | 4 | 13 | -1 |
| dp52 | 7 | 16 | -1 |
| dp53 | 17 | 17 | -1 |
| dp54 | 14 | 12 | -1 |
| dp55 | 6 | 5 | -1 |
| dp56 | 14 | 5 | -1 |
| dp57 | 5 | 4 | -1 |
| dp58 | 15 | 4 | -1 |
| dp59 | 2 | 9 | -1 |
| dp60 | 18 | 9 | -1 |
| dp61 | 10 | 17 | -1 |
| dp62 | 10 | 2 | -1 |
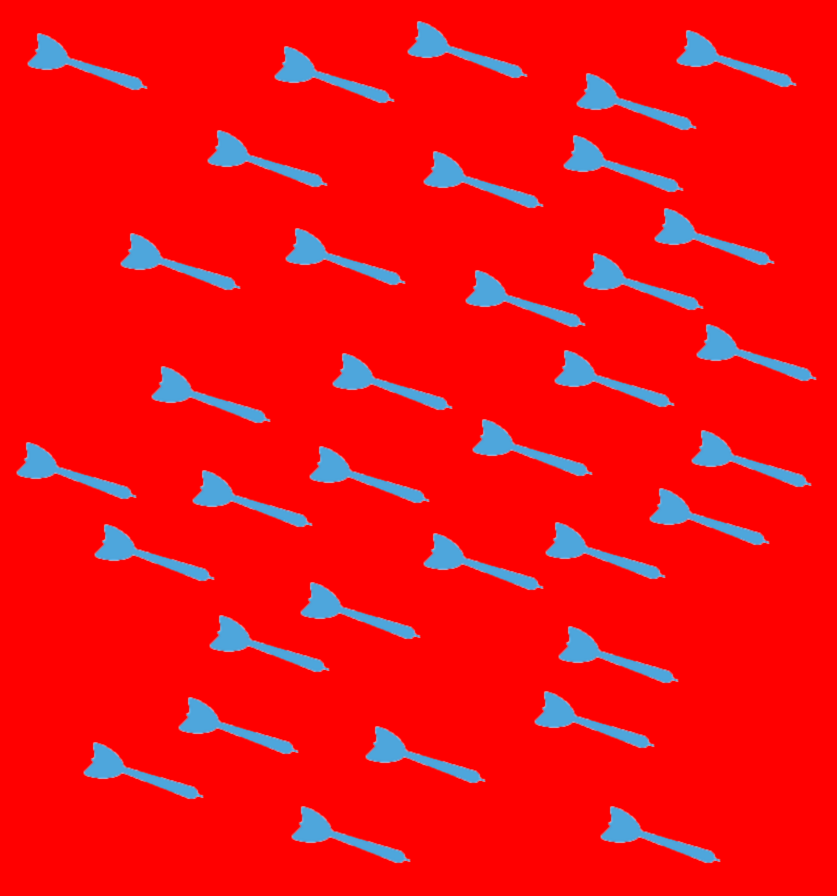
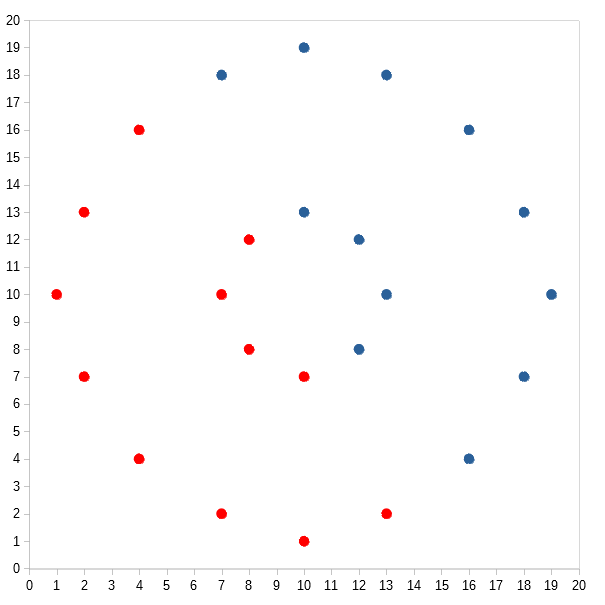
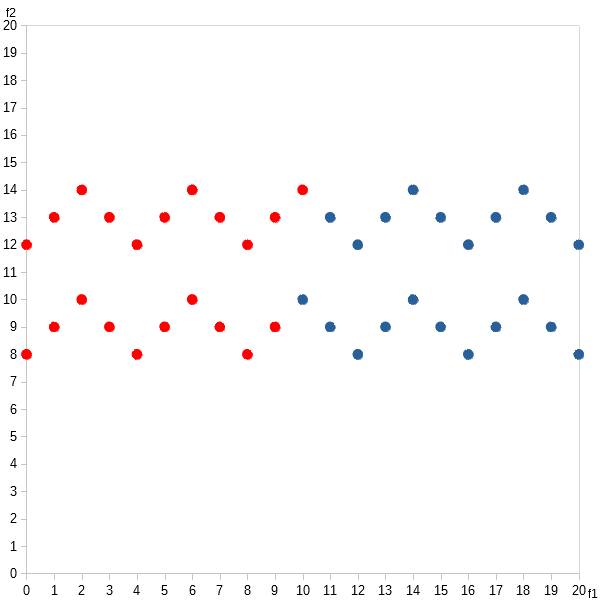
Pretty, innit? I call it the butterfly algorithm.
But, wait! There’s actually another pattern hidden in the data. Can you see it?
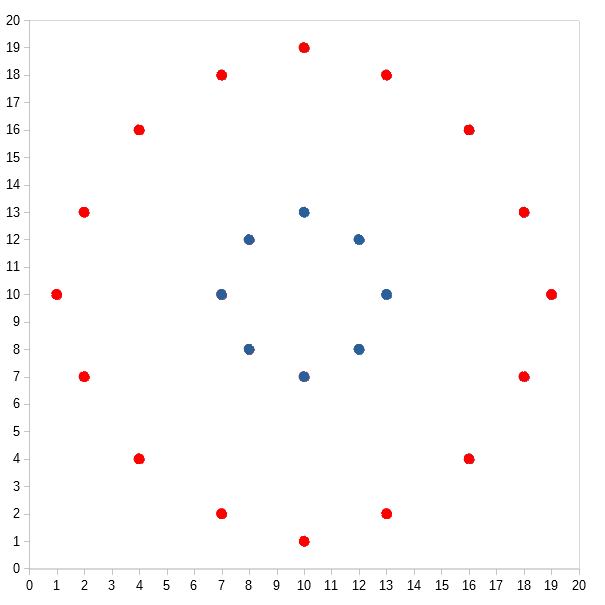
How about if I label the data points like this:
| Data Point | Feature 1 | Feature 2 | Label |
|---|---|---|---|
| dp1 | 3 | 2 | -1 |
| dp2 | 6 | 9 | -1 |
| dp3 | 2 | 19 | -1 |
| dp4 | 18 | 19 | -1 |
| dp5 | 17 | 2 | -1 |
| dp6 | 14 | 9 | -1 |
| dp7 | 10 | 9 | -1 |
| dp8 | 10 | 6 | 1 |
| dp9 | 10 | 11 | 1 |
| dp10 | 8 | 3 | -1 |
| dp11 | 9 | 5 | -1 |
| dp12 | 11 | 5 | -1 |
| dp13 | 12 | 3 | -1 |
| dp14 | 7 | 9 | 1 |
| dp15 | 13 | 9 | 1 |
| dp16 | 7 | 18 | -1 |
| dp17 | 13 | 18 | -1 |
| dp18 | 2 | 13 | -1 |
| dp19 | 18 | 13 | -1 |
| dp20 | 3 | 4 | -1 |
| dp21 | 17 | 4 | -1 |
| dp22 | 9 | 14 | -1 |
| dp23 | 11 | 14 | -1 |
| dp24 | 2 | 16 | -1 |
| dp25 | 18 | 16 | -1 |
| dp26 | 4 | 7 | -1 |
| dp27 | 16 | 7 | -1 |
| dp28 | 3 | 11 | -1 |
| dp29 | 17 | 11 | -1 |
| dp30 | 15 | 19 | -1 |
| dp31 | 5 | 19 | -1 |
| dp32 | 10 | 13 | -1 |
| dp33 | 6 | 2 | -1 |
| dp34 | 14 | 2 | -1 |
| dp35 | 8 | 16 | -1 |
| dp36 | 12 | 16 | -1 |
| dp37 | 8 | 11 | 1 |
| dp38 | 12 | 11 | 1 |
| dp39 | 8 | 7 | 1 |
| dp40 | 12 | 7 | 1 |
| dp41 | 5 | 17 | 1 |
| dp42 | 8 | 13 | 1 |
| dp43 | 12 | 13 | 1 |
| dp44 | 15 | 17 | 1 |
| dp45 | 3 | 15 | 1 |
| dp46 | 6 | 12 | 1 |
| dp47 | 13 | 16 | 1 |
| dp48 | 17 | 15 | 1 |
| dp49 | 3 | 17 | 1 |
| dp50 | 16 | 13 | 1 |
| dp51 | 4 | 13 | 1 |
| dp52 | 7 | 16 | 1 |
| dp53 | 17 | 17 | 1 |
| dp54 | 14 | 12 | 1 |
| dp55 | 6 | 5 | -1 |
| dp56 | 14 | 5 | -1 |
| dp57 | 5 | 4 | -1 |
| dp58 | 15 | 4 | -1 |
| dp59 | 2 | 9 | -1 |
| dp60 | 18 | 9 | -1 |
| dp61 | 10 | 17 | -1 |
| dp62 | 10 | 2 | -1 |
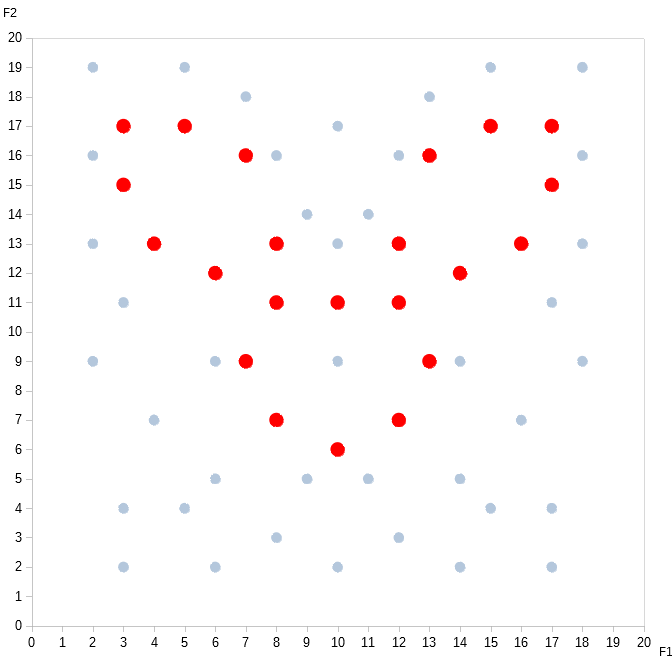
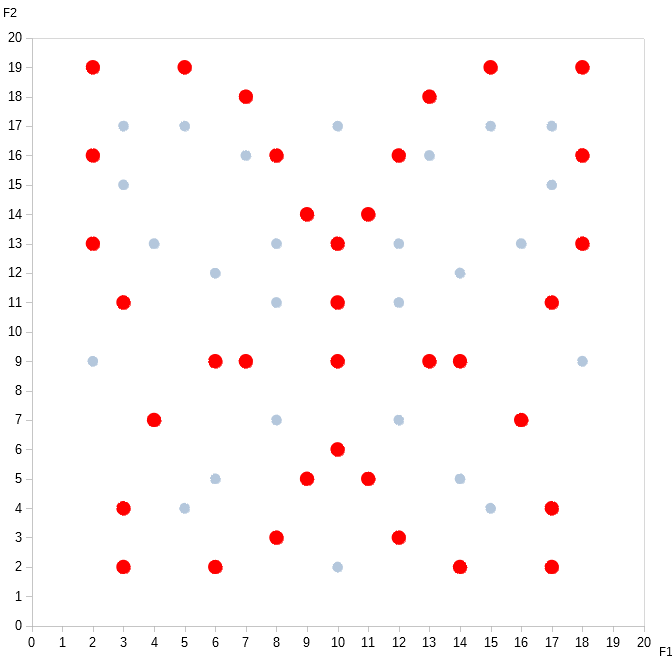
Now do you see it? I call it the bunny rabbit algorithm.
What do we normally call this process of “connecting the dots” in a way that no one else has before — to reveal previously hidden relationships? Creativity. And boy, does unsupervised learning offer plenty of room for that!
Just this dataset alone, where we have only two labels and 62 data points, we still get 262 = 4,611,686,018,427,388,000 different possible sets of labels! That’s four quintillion! Granted, most of them are random labelings — but even if we’re able to eliminate, say, 99% of these sets, that still leaves 46,116,860,184,273,880, or 46 quadrillion possibilities showing some kind of pattern.
We do have to be careful, though, that the patterns we perceive indeed describe real relationships intrinsic to the data themselves, and not extrinsic patterns that exist only from the observer’s perspective. Like, when we see shapes in cloud formations, stellar constellations, or Rorschach tests.
Or when we engage in conspiracy theories. And, yes, machine learning systems are susceptible to conspiracy theories, too. Oh, sure, the machines may scoff at us for thinking there are UFOs in Area 51. But that’s only because they know the military actually stores them in Area 53.
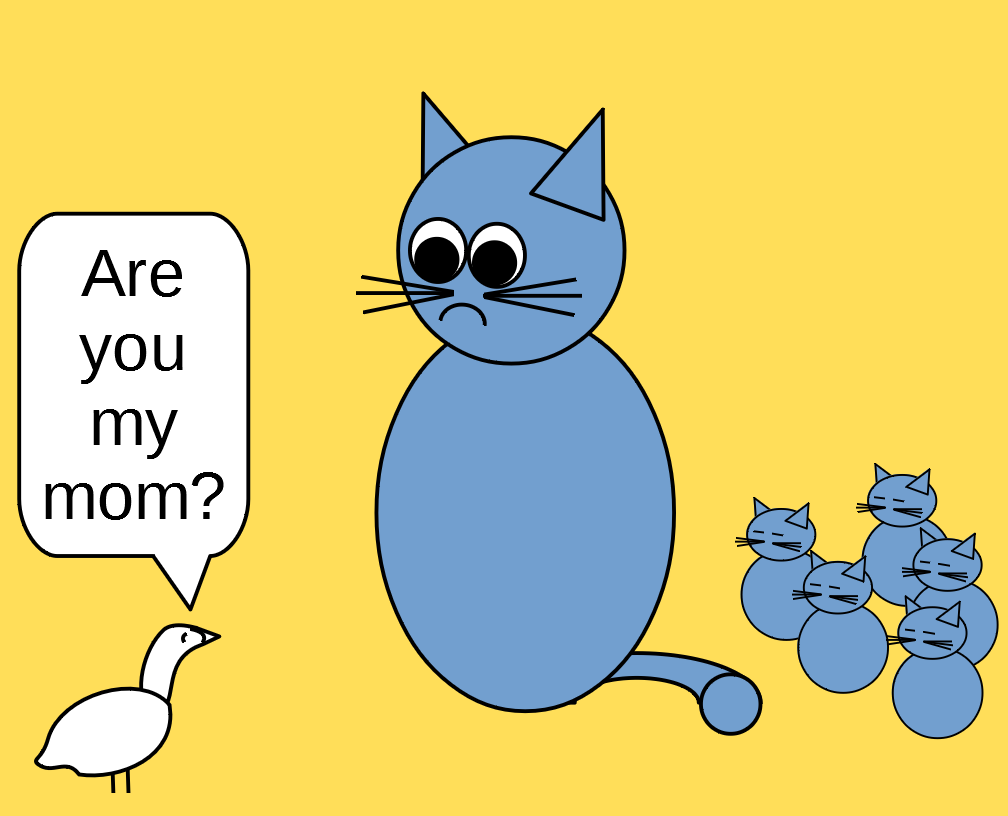
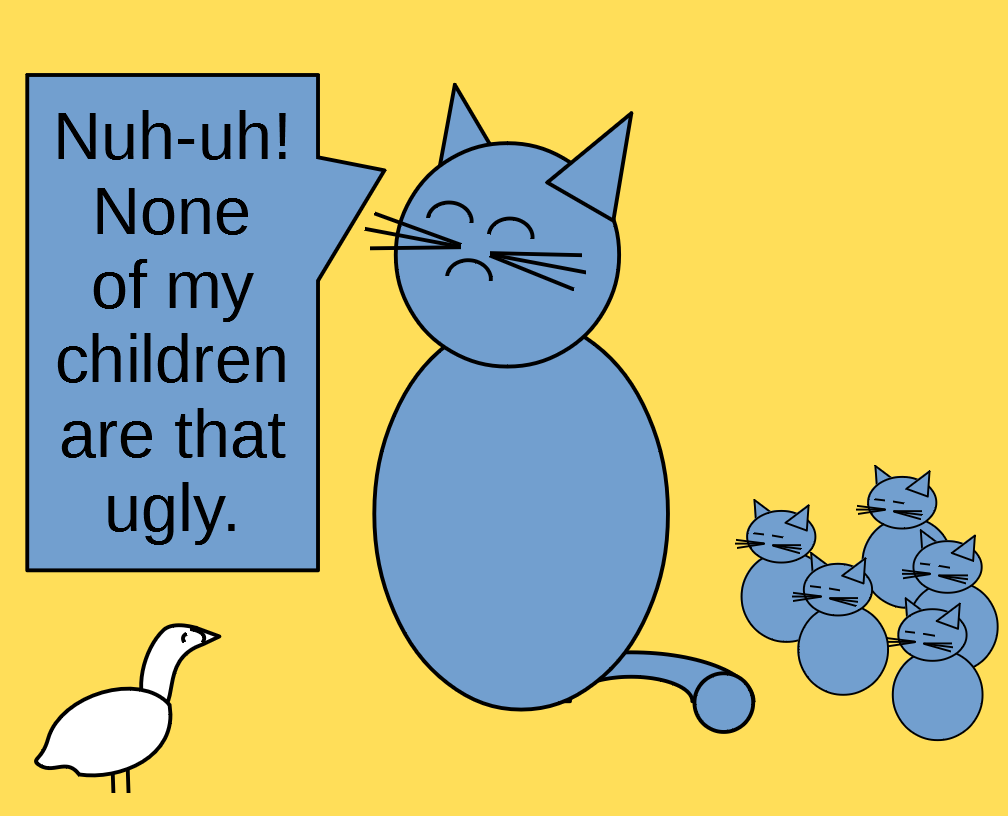
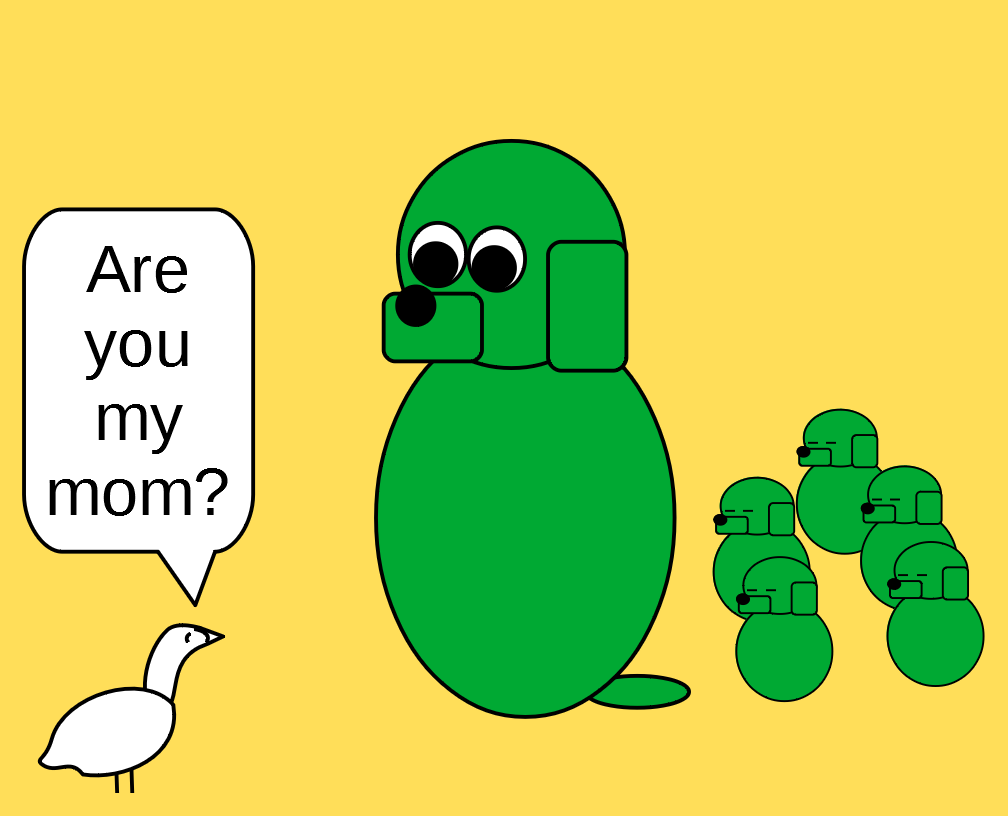
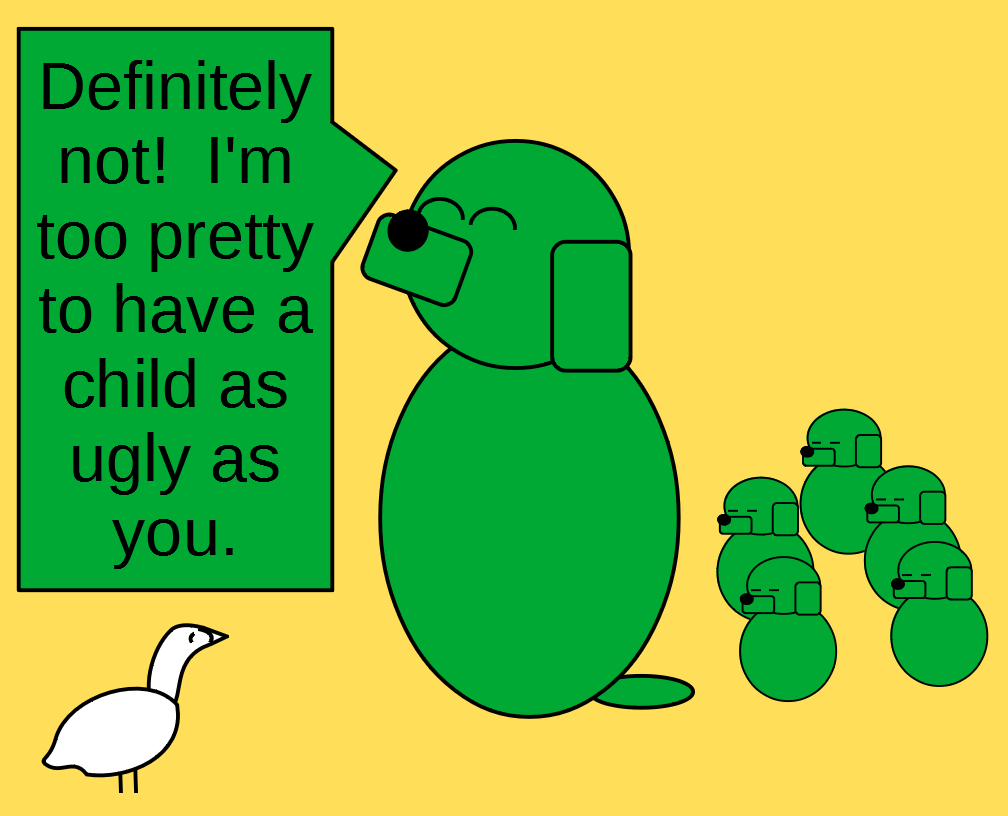
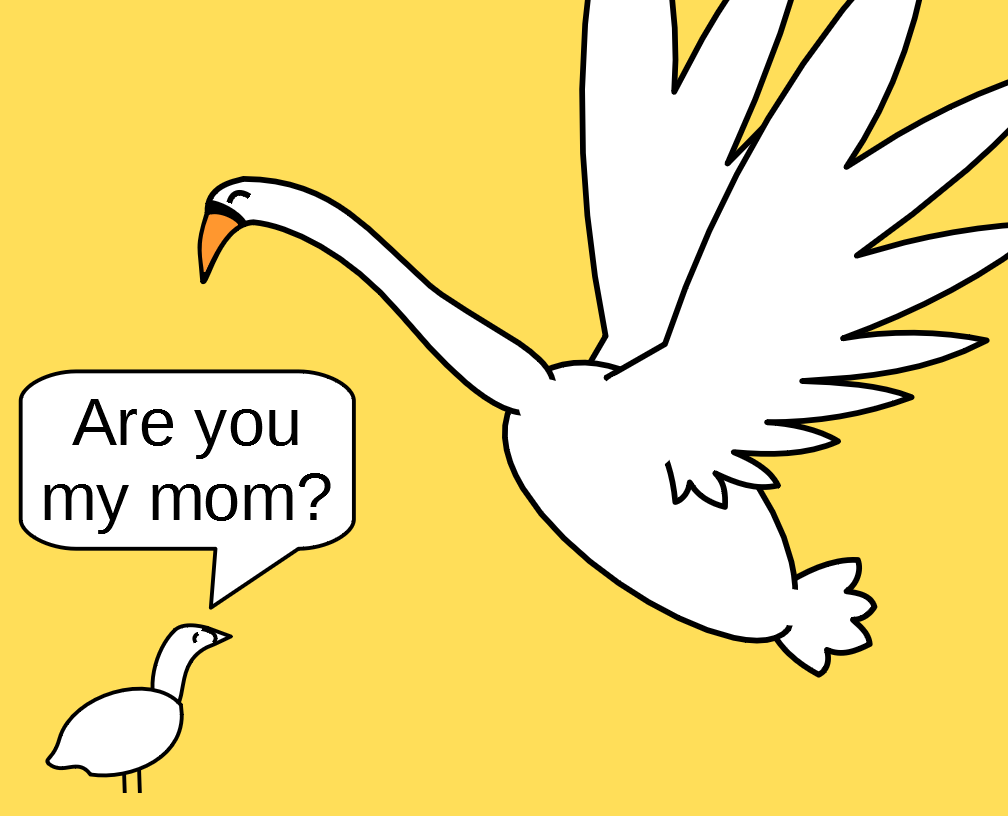
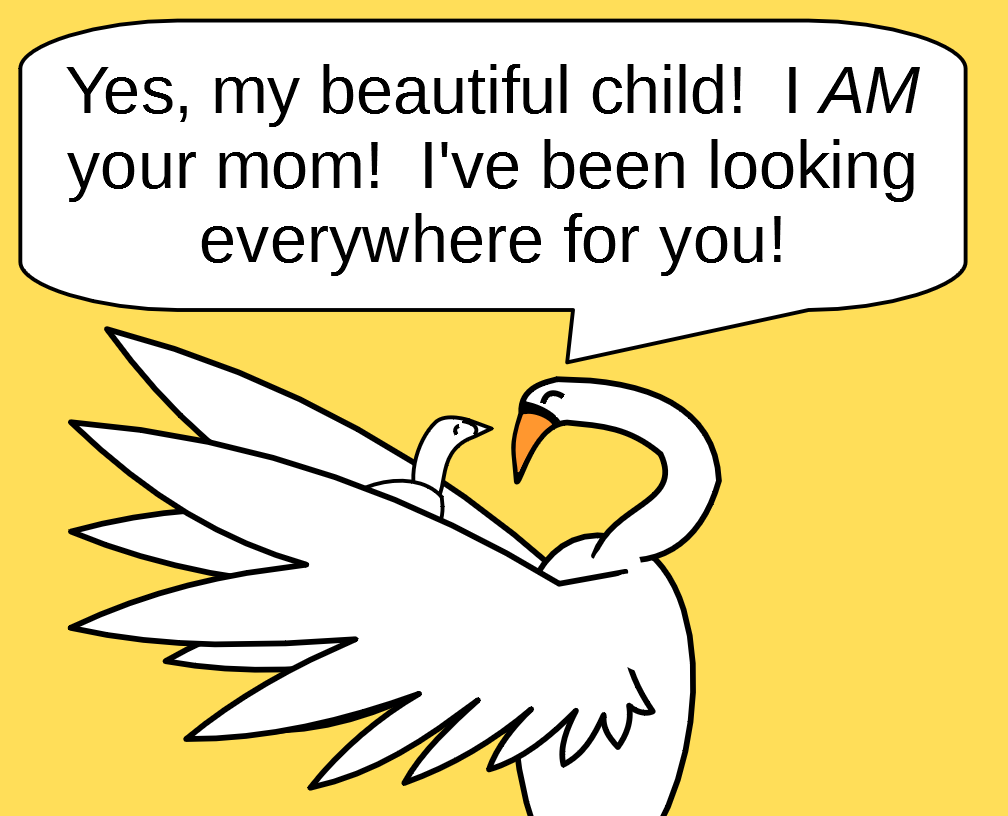
Birds of a Feather
Sadly, if you read a machine learning textbook or take a machine learning course, you will never see any mention of beautiful butterfly algorithms, nor adorable bunny rabbit algorithms. That’s because no one has been successful in utilizing them for anything.
YET. I still hold out hope that we’ll find a use for them someday.
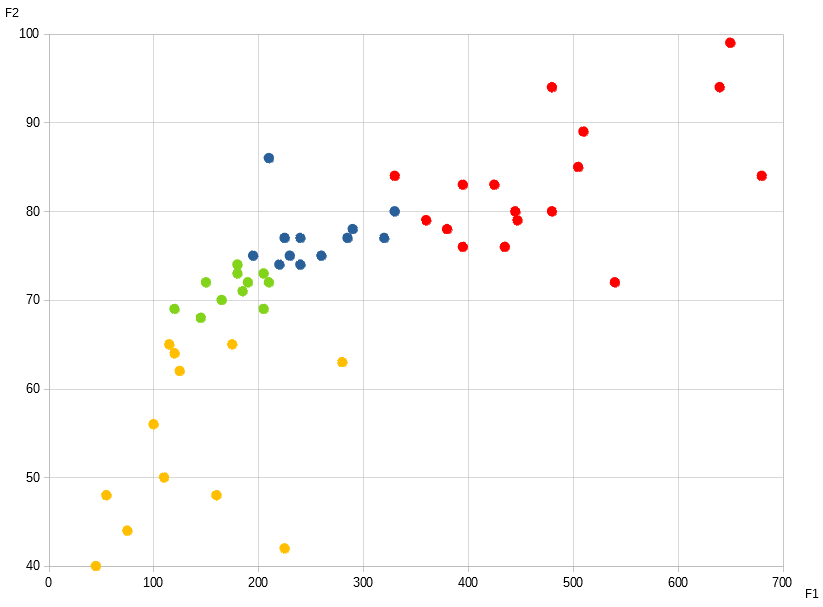
What you will see a lot of, however, are clusters:
Heavens to Betsy! This looks like a frightful rash! The sheer ugliness of clusters would offend the sensibilities of artists everywhere!
Well, maybe not Jackson Pollock.
Clustering algorithms group data points based on how similar they are with one another. The idea behind this is that data points that have many features, traits, and characteristics in common tend to “congregate” near one another if plotted out in a featurespace. It subscribes to the idea that “birds of a feather, flock together.” In other words, if it walks like a duck, quacks like a duck, and swims like a duck — then chances are, it’s chain-smoking in the bathroom and hanging out with the bad kids. You’ve repeatedly told the duck to stay away from those kids, but it just won’t listen.
What constitutes similar is up for debate. Like everything else in unsupervised learning, you have a dizzying array of options to choose from. And, there are a zillion different clustering algorithms that utilize these similarity measures in different ways.
The reason why these algorithms are so popular — despite being ugly AF — is because they’ve proven to be very useful. Here’s a marketing example. The graph above represents the heights and weights of various Marvel comic characters:
» Superhero Database
» Height Scale for Marvel Characters
» 27 Marvel Comics Characters Who've Gained The Hulk's Powers
» Who Are Marvel's Smallest and Tallest Characters?
Cluster 1 → Monstrosity
Cluster 2 → Above Average Build
Cluster 3 → Average Build
Cluster 4 → Petite Build
| Character | F1 Weight (in lbs) | F2 Height (in inches) | Label |
|---|---|---|---|
| Incredible Hulk ( Bruce Banner ) | 700 | 89 | Monstrosity |
| Sasquatch ( Walter Langowski ) | 640 | 94 | Monstrosity |
| Hemingway | 480 | 94 | Monstrosity |
| Juggernaut ( Cain Marko ) | 650 | 99 | Monstrosity |
| Colosus ( Peter Rasputin ) | 510 | 89 | Monstrosity |
| Man-Thing ( Dr. Theodore Stills ) | 505 | 85 | Monstrosity |
| Red Hulk ( General Thaddeus Ross ) | 680 | 84 | Monstrosity |
| Apocalypse ( En Sabah Nur ) | 330 | 84 | Monstrosity |
| Omega Red ( Arkady Rossovich ) | 425 | 83 | Monstrosity |
| Hellboy ( Anung Un Rama ) | 395 | 83 | Monstrosity |
| Abomination ( Emil Blonsky ) | 445 | 80 | Monstrosity |
| A-Bomb ( Rick Jones ) | 445 | 80 | Monstrosity |
| Red She-Hulk / Betsy Ross | 480 | 80 | Monstrosity |
| Thanos | 447 | 79 | Monstrosity |
| She-Hulk ( Jennifer Walters ) | 360 | 79 | Monstrosity |
| Doc Samson ( Dr. Leonard Skivorski, Jr. ) | 380 | 78 | Monstrosity |
| Deathlok ( Luther Manning ) | 395 | 76 | Monstrosity |
| Totally Awesome Hulk ( Amadeus Cho ) | 435 | 76 | Monstrosity |
| Thing ( Ben Grimm ) | 540 | 72 | Monstrosity |
| Yondu Udonta | 210 | 86 | Above Average Build |
| Cable ( Nathan Summers ) | 330 | 80 | Above Average Build |
| Thor Odinson | 290 | 78 | Above Average Build |
| Rhino ( Aleksei Sytsevich ) | 320 | 77 | Above Average Build |
| Mister Sinister ( Nathaniel Essex ) | 285 | 77 | Above Average Build |
| Iron Man ( Tony Stark ) | 225 | 77 | Above Average Build |
| Silver Surfer ( Norrin Radd ) | 240 | 77 | Above Average Build |
| Hawkeye ( Clint Barton ) | 230 | 75 | Above Average Build |
| Cyclops ( Scott Summers ) | 195 | 75 | Above Average Build |
| Venom ( Eddie Brock ) | 260 | 75 | Above Average Build |
| Captain America ( Steve Rogers ) | 220 | 74 | Above Average Build |
| Adam Warlock | 240 | 74 | Above Average Build |
| Dr. Stephen Strange | 180 | 74 | Average Build |
| Sandman ( William Baker ) | 205 | 73 | Average Build |
| Mr. Fantastic ( Reed Richards ) | 180 | 73 | Average Build |
| Black Panther ( TChalla ) | 210 | 72 | Average Build |
| Professor X ( Charles Francis Xavier ) | 190 | 72 | Average Build |
| Archangel ( Warren Kenneth Worthington III ) | 150 | 72 | Average Build |
| Green Goblin ( Norman Osborn ) | 185 | 71 | Average Build |
| Spiderman ( Peter Parker ) | 165 | 70 | Average Build |
| Agent Phillip J. Coulson | 205 | 69 | Average Build |
| Rogue ( Anna Marie ) | 120 | 69 | Average Build |
| Iceman ( Bobby Drake ) | 145 | 68 | Average Build |
| Black Widow ( Natasha Romanoff ) | 130 | 67 | Average Build |
| Vanisher | 175 | 65 | Petite Build |
| Jubilee ( Jubilation Lee ) | 115 | 65 | Petite Build |
| Quill ( Max Jordan ) | 120 | 64 | Petite Build |
| Wolverine ( Logan ) | 280 | 63 | Petite Build |
| Firestar ( Angelica Jones ) | 125 | 62 | Petite Build |
| Franklin Richards ( Powerhouse ) | 100 | 56 | Petite Build |
| Batwing ( James Santini ) | 110 | 50 | Petite Build |
| Rocket Raccoon | 55 | 48 | Petite Build |
| Fusion ( Hubert & Pinky Fusser ) | 160 | 48 | Petite Build |
| Gargouille ( Lavina LeBlanc ) | 75 | 44 | Petite Build |
| Puck ( Eugene Judd ) | 225 | 42 | Petite Build |
| Fader | 45 | 40 | Petite Build |
If we group together characters of similar build, we can tailor our ads to particular individuals. The hope is that the more similar the people in a group are, the more likely it is that they have to deal with similar problems — and hence be interested in the same products / solutions. For example, the Hulk is always needing new pants. One can target the following ad to him:
Had another “freakout” and need new pants again?
Why not try our stretchy pants instead? No matter what bizarre changes your body goes thru, these pants will never rip, tear, nor break apart! Buy one pair, and it’ll last you a lifetime!

Available in purple, dark purple, royal purple, deep violet, and lavender.
Bruce Banner upon seeing this would exclaim, “Oh my god, yes! It’s like this ad is speaking to me!” He would immediately place an order for 100 pairs of stretchy pants. But if we show it to Black Widow on the other hand, she would probably think, “Why would I need stretchy pants? I’m, like, always a size 4!” The ad may not be effective on her, but other Marvel characters in similar situations as Banner is may find this ad very helpful.
Behold! Beauty!
Okay, you’ve slogged thru all the many, many options. You’ve narrowed down the features to just the ones you want. You’ve researched your data thoroughly and are certain that there are real intrinsic relationships, not just pseudo-patterns. You’ve investigated all the different clustering algorithms and have settled on the one that seems best to fit you needs. And now, after all that, you finally end up with a bunch of clusters. But, how do you know whether these clusters have correctly classified your data set? To determine that, you would need to use a validation measure.
Unfortunately, as you should expect by now, there are a mind-boggling number of such measures.
Even more unfortunate, these measures don’t actually tell you whether your clusters are correct or not. They can only tell you how closely your clusters fit a particular set of criteria. In other words, they can only determine how “pretty” your clusters look. Validation measures are aesthetics metrics. Remember, there are no right or wrong answers in unsupervised learning. Aesthetics measures are about the best we can do.
Each measure defines “beauty” differenlty. That there are so many different definitions simply proves that beauty truly is in the eye of the beholder!
Most measures use one or both of these metrics — compactness and separateness. Compactness measures how varied the data points within each cluster are. The less varied, the higher the compactness. Separateness measures how “tangled” your clusters are. If they’re intertwined together, your clusters have low separateness. If they’re far apart, they get a high separateness score.
The Ugly Duckling

Unfortunately, separateness and compactness tend to bias towards clusters that are “clumpy” and ball-shaped. They consider these types of clusters to be more beautiful than, say, clusters that are long and stringy. Which means they tend to favor algorithms like k-Means.
K-Means is an iterative algorithm that places each data point into the cluster whose center ( a. k. a. the mean ) is closest to it. Once all the data points are assigned, the centers are recalculated — because when new data points are added to a cluster, its center necessarily shifts. The algorithm then checks every data point again to see if a different cluster is now closer to it. If so, the data point gets reassigned. The algorithm repeats this process over and over until no more data points get reassigned.
This type of algorithm likes to produce clumpy, ball-shaped clusters that would score highly on most validation measures. Unfortunately, most datasets are not clumpy and ball-shaped. Here are two examples:
K-Means would cluster like so:
There are a bunch of algorithms, such as DBSCAN, that attempts to organize data similar to the way we humans do. They’re density-based, which means they subscribe to the idea that data points within clusters are more tightly packed together than the areas between clusters. So, DBSCAN would cluster the two data sets like so:
Unfortunately, it’s difficult to measure how “beautiful” these kinds of clusters are. Most validation measures would rate them very low — close to falling-out-of-an-ugly-tree-and-hitting-all-the-branches-on-the-way-down low.
To get a better measure, you would need to “roll” your own. First, you would create synthetic data that represents what your ideal “perfect 10” cluster would look like — a.k.a. the ground truth. Then, you would use an external validation measure, like mutual information, F-measure, etc., that compares your clusters to the ground truth to see how close they come to your standards.
This would be like you creating a checklist before going on a date, and then seeing how many items your date checks off:
- “You have a pet? How wonderful, I love pets! Check!”
- “Oh, it’s a rabbit? I’m allergic to rabbits. Uncheck!”
- “You graduated from an Ivy League? That’s fantastic! Check!”
- “Wait, what? It’s Dartmouth?! Double uncheck!”
- “You’re a lawyer? Brilliant! Triple check!”
- “Excuse me? You became a public defender to help poor people?! Quadruple uncheck!”
Best Way to Tackle an Unsupervised Learning Problem
All this is to say, there are no easy answers in unsupervised learning. To keep from getting overwhelmed by the myriad of choices, the best way to begin an unsupervised learning problem is to look within. You need to first do some serious soul-searching to determine what actually matters to you, and how you would define success and failure. Then, let that insight guide you towards the right features, the right clustering algorithm, the right measure, etc. that reflects what’s important to you.
Machines require much more hand-holding when doing unsupervised learning problems than when doing supervised learning problems. This is because machines don’t do soul-searching. They are only capable of carrying out instructions given to them.
With supervised learning, you can simply unleash the machine. Like a rabid dog, it will relentlessly hunt down the right answers — or die trying. With unsupervised learning, however, it will act more like an overly enthusiastic puppy with attention deficit disorder — chasing beautiful butterflies, adorable bunny rabbits, and whatever else crosses its path — unless you give it direction. YOU have to do the self-analysis, and then design the machine to reflect YOUR values.
Blogging Improves Your Skin and Removes Wrinkles!
And finally, writing this very blog is an unsupervised learning task. While there is no right way or wrong way to produce a blog, I also didn’t randomly throw words together to create gibberish. Before doing the actual writing, I spent a lot of time trying to figure out what I wanted to accomplish. I eventually settled on writing in such a way that would enable anyone reading my posts to be able to understand the broad strokes of machine learning without needing to wade through four years of computer science study.
This objective has guided me in every decision regarding the design, the tone, and the topics that I write about:
- I limit the number of fancy-schmancy equations.
- I maintain a conversational tone.
- I try to keep my posts light-hearted.
- And, most importantly, I write about you — in the hopes that you find yourself interesting and will stay engaged — eager to read on about your latest and greatest adventures.
As for determining how “pretty” my blog looks, my validation measure will be based on the comments you leave – letting me know if I’ve succeeded in helping you acquire a better understanding of this field.

“Doc, I have this recurring dream where a mean-ass looking clown is beating me senseless with his giant red shoes. What does it mean?”
“Well, I can only think of two possibilities. Either, A) you once really were beaten senseless by a mean-ass looking clown with his giant red shoes. Or, B) you were obsessed with scaling Mt. Everest. The clown in your dream represents the trauma your body had had to endure while you were in training and then when you were making the actual climb.”
“Oh my gosh, how did you know?! Yes, a while back, I was deeply inspired to climb Mt. Everest. My friends and family all I thought I was crazy, but I was determined.
“I knew my body wasn’t ready to take on such an arduous climb, so I spent the next two years training to improve my stamina and conditioning. Oh man, the pain! The torn muscles, the broken bones. Numerous times I seriously thought about quitting, but I persevered. When I finally felt ready, I flew over there and tackled the challenge.
“God, it was the hardest thing I’d ever done. I frequently wanted to head back down. But somehow, I just kept pressing on. Until, finally, with my last ounce of strength, I pulled myself up to the very top! It was so exhilarating!
“Unfortunately, that feeling was short-lived. I turned around and ended up face-to-face with a mean-ass looking clown — who proceeded to beat me senseless with his giant red shoes. How did you get all that from just my dream, Doc?”